



Abstract
The organization of immune cells in human tumors is not well understood. Immunogenic tumors harbor spatially localized multicellular ‘immunity hubs’ defined by expression of the T cell-attracting chemokines CXCL10/CXCL11 and abundant T cells. Here, we examined immunity hubs in human pre-immunotherapy lung cancer specimens and found an association with beneficial response to PD-1 blockade. Critically, we discovered the stem-immunity hub, a subtype of immunity hub strongly associated with favorable PD-1-blockade outcome. This hub is distinct from mature tertiary lymphoid structures and is enriched for stem-like TCF7+PD-1+CD8+ T cells, activated CCR7+LAMP3+ dendritic cells and CCL19+ fibroblasts as well as chemokines that organize these cells. Within the stem-immunity hub, we find preferential interactions between CXCL10+ macrophages and TCF7−CD8+ T cells as well as between mature regulatory dendritic cells and TCF7+CD4+ and regulatory T cells. These results provide a picture of the spatial organization of the human intratumoral immune response and its relevance to patient immunotherapy outcomes.
Multicellular networks are critical in mediating immune responses. An important question is how immune cells organize within tumors to effectively eliminate malignant cells. To address this, we previously reported on differences in the baseline immune microenvironment between human mismatch repair deficient (MMRd) and mismatch repair proficient (MMRp) colorectal cancer (CRC). Compared to patients with MMRp, patients with MMRd CRC are dramatically more responsive to immune checkpoint inhibition1. Based on covarying transcriptional signatures and multispectral imaging of CRC tissues, we observed defined foci of activated T cells expressing IFNG abutting malignant and myeloid cells expressing interferon-stimulated genes (ISGs), including the T cell-attracting chemokines CXCL10 and CXCL11 (ref. 2). This finding suggests the existence of a positive feedback loop in which activated T cells drive further T cell recruitment.
Cytotoxic CD8+ T cells are known to be highly favorable for immunotherapy response across many cancer types3,4. Various CD8+ T cell differentiation states may contribute to immunotherapy response. Activated PD-1+ and proliferating Ki67+CD8+ T cells are predictive of response5,6, suggesting that ongoing CD8+ T cell effector activity may be a good predictor of PD-1-blockade responsiveness. Consistent with these findings, prior studies showed that immunotherapy outcomes (including in lung cancer7) are positively correlated with interferon (IFN)-γ-related expression signatures7-9, including the T cell-attracting chemokine CXCL10 in melanoma10. In addition, the stem-like TCF7+PD-1+CD8+ T cell population has been associated with subsequent patient response to immunotherapy11,12, and shown to form a reservoir for the proliferative burst of tumor-specific effector CD8+ T cells in mice critical for immunotherapy response13-15. However, the spatial organization of these T cell states and their relationships to other cells in the tumor microenvironment are not well understood.
Lung cancer is the leading cause of cancer-related mortality worldwide, and PD-1 blockade is the mainstay immune checkpoint inhibition therapy, despite only a subset of patients responding to treatment16. By performing multiplex RNA-based and protein-based imaging, as well as spatial transcriptomics, on tumor tissue from a clinically annotated cohort of patients with immunotherapy-naive non-small cell lung cancer (NSCLC), we define multicellular networks involved in the antitumor immune response—findings that have implications for predicting and augmenting immunotherapy outcomes.
Results
Immunity hubs are associated with immunotherapy response and T cells
We previously identified and defined ‘immunity hubs’ as spatially organized immune cells in MMRd CRC tumors, based on localization of specific markers in tumor samples. In the current study, we hypothesized that these immunity hubs are associated with response to anti-PD-1 immunotherapy. To test this, we visualized immunity hubs using single-molecule fluorescence in situ hybridization (smFISH) RNA probes to localize expression of the previously identified immunity hub markers CXCL10/CXCL11 (T cell-attracting chemokines), IFNG (T cell activation marker), CD3E (T cell marker), CXCL13 (tumor-reactive T cell marker17-21), an antibody cocktail against pan-cytokeratin (PanCK) to mark epithelium, and DAPI (nuclear marker; see in panel 1 in Fig. 1a-d). We collected tissue specimens before standard-of-care anti-PD-1 treatment from a cohort of 68 patients with NSCLC (one specimen per patient), imaged each specimen for the presence of immunity hubs, and tested for association with clinical response. Twenty patients demonstrated objective response (complete response or partial response by RECIST version 1.1 criteria22) and the remaining 48 patients did not (stable disease or progressive disease); additional clinicopathologic characteristics are summarized in Supplementary Table 1a,b.
Fig. 1 ∣. Immunity hubs in tumors are associated with positive clinical responses in patients with NSCLC.

a, Serial sections of pre-PD-1-blockade formalin-fixed paraffin-embedded (FFPE) NSCLC samples were stained with two multiplex fluorescence panels for 68 patients (20 responders and 48 non-responders; created with BioRender.com). Panel 1 uses RNA smFISH/IF to identify immunity hub components and panel 2 solely uses immunofluorescence (IF) to determine CD8+ T cell states. Whole-slide images were captured and analyzed by automated cell segmentation and phenotyping. b, Representative low-power image of one of the 68 tumors (patient no. 43) stained with the multiplexed RNA smFISH/IF panel. c, High-power view from the boxed region in b showing an immunity hub. Cells positive for IFNG are circled in white. d, High-power view of a hematoxylin and eosin (H&E)-stained serial section from an area matched to that in c. e, Representative image of a tumor section (patient no. 43) stained with the multiplexed RNA-ISH/IF panel shows the focal expression pattern of CXCL10/CXCL11 (red). f, A grid of 50 × 50-μm windows was overlaid on images. CXCL10/CXCL11+ windows (red) were identified using k-means clustering based on CXCL10/CXCL11+ cell count (k = 2). g, Adjacent CXCL10/CXCL11+ windows were aggregated into immunity hubs. Singleton windows were not included as hubs. h, Immunity hub area as a fraction of total tumor area in responders (R; complete response and partial response; n = 20) versus non-responders (NR; stable disease and progressive disease; n = 48). Two-sided Mann–Whitney test P value is shown. i, Paired comparisons of density of cellular phenotypes from the RNA-ISH/IF panel within immunity hubs versus total assessed area, colored by response status (n = 59; 1 R and 8 NR tumors lacked immunity hubs). j, Paired comparisons of density of cellular phenotypes from the IF-only panel within immunity hubs versus total assessed area, colored by response status (n = 43; 22 samples had images that could not be co-registered, and 3 samples lacked immunity hubs). Each pair of dots connected by a colored line represents a patient. Horizontal black lines denote the median and 95% confidence interval. Two-sided Wilcoxon matched-pairs signed-rank test Benjamini–Hochberg (BH)-adjusted P values are shown.
We first analyzed intratumoral regions, as delimited by the outer border of morphologically neoplastic PanCK+ cells. We defined an immunity hub as the neighborhood around CXCL10/CXCL11+ cells (by aggregating contiguous 50 × 50-μm windows and excluding windows with <7 cells; Fig. 1e-g), thus identifying 3,777 immunity hubs across 68 samples. We found a 5.5-fold increase of the median frequency of immunity hubs in anti-PD-1 responders relative to non-responders (median of 1.6% of tissue area in responders, 0.30% in non-responders; Fig. 1h). Similarly to our findings in CRC, hubs in NSCLC samples were enriched in IFNG+ (median 4.7-fold increase; median 115 cells per mm2 in hubs versus 16 cells per mm2 overall) and CD3E+ cells (median 3.0-fold increase; median 782 cells per mm2 in hubs versus 204 cells per mm2 overall; Fig. 1i).
Given that activated CD8+ T cells express CXCR3 (the receptor for CXCL10 and CXCL11)23, we hypothesized that activated CD8+ T cell populations would be attracted to immunity hubs. We therefore built a multiplexed antibody panel to assess CD8+ T cell states (Fig. 1a; ‘panel 2’) and stained sequential serial tissue sections from the same 68 patient samples (overall enumeration of cellular frequencies by patient in Supplementary Table 1c,d). To integrate our two staining panels, we computationally co-registered 46 paired serial sections (non-responders = 33, responders = 13) with sufficiently matched regional architecture (Extended Data Fig. 1a-d), leading to 2,712 observed immunity hubs in the co-registered regions. Immunity hubs harbored a higher density of CD8+ T cells relative to the overall tumor (median 2.8-fold increase by paired analysis; median 884 cells per mm2 in hubs versus 210 cells per mm2 overall), including CD8+ T cell substates, such as activated PD-1+ (median 3.5-fold increase by paired analysis; median 123 cells per mm2 in hubs versus 31 cells per mm2 overall) and stem-like TCF7+PD-1+CD8+ T cells (median 3.2-fold increase by paired analysis; median 16 cells per mm2 in hubs versus 4 cells per mm2 overall; Fig. 1j). These data demonstrate that immunity hubs are associated with subsequent beneficial responses to PD-1 blockade and are potential foci of CD8+ T cell activity.
A favorable subclass of immunity hubs enriched for stem-like T cells
We hypothesized that there may be subtypes of immunity hubs with distinct cellular compositions. We performed unsupervised subclustering of the 2,712 immunity hubs based on frequencies of cell types, revealing seven subclusters (Fig. 2a; each dot on the t-distributed stochastic neighbor embedding (t-SNE) plot represents one immunity hub) with representation across multiple patients (Extended Data Fig. 1e-i). No immunity hub subcluster showed an association with unfavorable outcomes (Extended Data Fig. 1j-l). The fraction of area occupied by subcluster 3 was elevated 106-fold in responder patients (median 1.1% of total area in responders versus 0.011% in non-responders; Fig. 2b-d and Extended Data Fig. 1j). Consistently, patients with subcluster 3 representing at least 0.1% of total area experienced superior progression-free survival (PFS) and overall survival (OS) relative to patients below this threshold (Fig. 2e,f and Extended Data Fig. 1k,l).
Fig. 2 ∣. A class of immunity hubs with IFNG+ cells and TCF7+PD-1+CD8+ T cells.

a, Leiden analysis of immunity hubs reveals seven subclusters. Each point on the t-SNE plot represents one immunity hub. b, Leiden subcluster composition by patient, plotted by the proportion of tumor area in each subcluster. Hash symbols denote two patients classified by RECIST as non-responders based on progression in the central nervous system but showed systemic immunotherapy response (Results). c, Mean rank difference and associated BH-adjusted P values calculated for each Leiden subcluster by comparing responders versus non-responders. Values are derived from two-sided Mann–Whitney tests (Extended Data Fig. 1j). d, Immunity hub subcluster 3 is enriched in responders. The proportion of tumor area in subcluster 3 is shown for each patient (NR = 33 and R = 13 patients). Hash symbols denote the two aforementioned patients. BH-adjusted, two-sided Mann–Whitney test, P = 0.00004. e,f, Immunity hub subcluster 3 is associated with increased PFS (e) and OS (f) by Kaplan–Meier analysis (two-sided log-rank test, BH-adjusted P P P values). Patients were classified as above or below a threshold of 0.1% of total tumor area for subcluster 3. Units of time are in days. BH-adjusted P values are shown. g, Immunity hub composition by subcluster for indicated phenotypes. Phenotype counts were normalized by immunity hub area and scaled from 0 to 1. Each point represents the mean value across all immunity hubs of a given Leiden subcluster for each patient having that subcluster (number of patients having subcluster: 1 = 18, 2 = 33, 3 = 31, 4 = 11, 5 = 27, 6 = 25, and 7 = 30). In the box plots, the center line indicates the median, box minima and maxima represent the interquartile range, and whiskers are 1.5 times the interquartile range. Statistical comparison was performed using an unpaired two-sided Mann–Whitney test relative to subcluster 3. BH-adjusted P values shown: NS, not significant; *P < 0.05, **P < 0.01, ***P < 0.001, and ****P < 0.0001. h, 0–1 scaled phenotype counts, as in g and Extended Data Fig. 1m, but for each of the 2,712 hubs (columns). i, Spatial map of tissue from a responder (patient no. 28) showing immunity hubs color coded by Leiden subclusters (left). A region containing three subcluster 3 immunity hubs is indicated by a box in the spatial map. Images (center and right) from the same boxed inset region are shown with the indicated markers. White scale bar denotes 100 μm. j, Spatial map (from patient no. 53) showing TCF7+ aggregates identified by k-means clustering (k = 2) based on PanCK−TCF7+ cell count. k, TCF7+ aggregate area (as a fraction of total area) plotted by response status. Statistical comparisons were performed using a two-tailed unpaired Mann–Whitney test (NR = 33 and R = 13 patients). l, Spatial map of tissue from the patient in j showing immunity hubs color coded by Leiden subcluster. m, Frequency of contact (at least touching in a cardinal direction) between TCF7+ aggregates and subcluster 3 immunity hubs versus other immunity hub subclusters (subclusters 1–2 and 4–7). Statistical comparison was performed using two-sided Fisher’s exact test on counts shown in Extended Data Fig. 1o.
Interestingly, patients 10 and 30 had a high frequency of subcluster 3 (Fig. 2b), but they were classified as non-responders by RECIST criteria due to isolated progression in the central nervous system. However, patient no. 10 showed a marked response in their chest lesion and a relatively long OS of 828 days (median OS for non-responders was 263 days and for responders was 846 days). Likewise, patient no. 30 showed a substantial extracranial response to therapy that remains ongoing (>5.5 years) despite discontinuing PD-1 blockade after a single dose due to drug-induced pneumonitis, supporting that subcluster 3 is positively associated with a response.
We next examined which cells were enriched in each immunity hub subcluster. Compared with the other subclusters, subcluster 3 was enriched for IFNG+ cells (median 2.4-fold increase in paired analysis, median 280 cells per mm2 in subcluster 3 versus 91 cells per mm2 in other subclusters; P < 0.0001 by two-tailed Mann–Whitney). Subcluster 1 was also enriched for IFNG+ cells and other T cells (including proliferating T cells; Fig. 2g,h and Extended Data Fig. 1m). In contrast to subcluster 1, subcluster 3 also stood out for increased nonepithelial PanCK−TCF7+ cells (median 4.7-fold in paired analysis, median 1,369 cells per mm2 in subcluster 3 versus 278 cells per mm2 in other subclusters; P < 0.0001 by two-tailed Mann–Whitney; Extended Data Fig. 1m), TCF7+CD8+ T cells (median 5.43-fold in paired analysis, median 570 cells per mm2 in subcluster 3 versus 78 cells per mm2 in other subclusters; P < 0.0001 by two-tailed Mann–Whitney), and, most notably, stem-like TCF7+PD-1+CD8+ T cells (median 9.7-fold in paired analysis, median 114 cells per mm2 in subcluster 3 versus 7 cells per mm2 in other subclusters; P < 0.0001 by two-tailed Mann–Whitney; Fig. 2g,h and Extended Data Fig. 1m). The density of TCF7+PD-1+CD8+ T cells outside the hubs in these tumors was just 6 cells per mm2, revealing subcluster 3 immunity hubs as distinct niches for stem-like CD8+ T cells within the entire tumor microenvironment. While TCF7+PD-1+CD8+ T cells (of all DAPI+ cells) were overall 3.47-fold higher in responders versus non-responders (median fraction of all DAPI was 0.00181 in responders and 0.0005215 in non-responders; nominal P = 0.0084 by unpaired two-tailed Mann–Whitney test; raw frequencies provided in Supplementary Table 1d), this was less significant than the presence of subcluster 3 (Fig. 2d), suggesting an especially favorable benefit conferred by the presence of these cellular niches. Consistent with the higher overall abundance of subcluster 3, a higher fraction of TCF7+PD-1+CD8+ T cells were found within subcluster 3 in responders than non-responders (Extended Data Fig. 1n). Inspection of images in locations assigned to subcluster 3 confirmed dense aggregates of TCF7+ cells, including TCF7+PD-1+CD8+ T cells (Fig. 2i and Extended Data Fig. 2). We also note that subcluster 3 showed high overall cell density but low density of epithelial cells (Fig. 2i and Extended Data Fig. 1m). We henceforth refer to subcluster 3 as a ‘stem-immunity hub’ based on the high concentration of TCF7+CD8+ T cells (which includes stem-like TCF7+PD-1+CD8+ T cells) and CXCL10/CXCL11 that together define these structures.
Given the striking abundance of TCF7+ cells in stem-immunity hubs, we further tested whether the observed strong association with response was attributable to aggregates of TCF7+ cells, irrespective of CXCL10/CXCL11 expression. To define aggregates of TCF7+ cells, we again used a 50 × 50-μm grid on co-registered images, using PanCK−TCF7+ cellular densities as input for k-means clustering (k = 2; Fig. 2j). We observed that the frequency of TCF7+ aggregates (Fig. 2k) only weakly trended with response. However, stem-immunity hub subcluster 3 (which strongly associated with response) was enriched for proximity to TCF7+ aggregates, relative to the other subclusters (Fig. 2l,m and Extended Data Fig. 1o). Thus, the presence of cellular niches containing both CXCL10/CXCL11 expression and TCF7+ cells was more favorably associated with PD-1-blockade responsiveness than either feature alone.
Stem-immunity hubs are enriched for mreg DCs and CCL19 expression
To comprehensively understand spatially organized hubs within NSCLC tumors, multiplexed error-robust FISH (MERFISH24) was used for single-cell resolution detection of 479 genes that mark immune, stromal and epithelial cell states (Fig. 3a). MERFISH is an imaging technology that measures gene expression using RNA probes with tails containing barcodes that are decoded through cyclical hybridization and imaging24. We selected four NSCLC cases with CXCL10/CXCL11+ expression and large tissue area from patients who subsequently responded to PD-1 blockade. First, we sought to phenotype cells present within the TME. We identified and labeled cells with our internal multi-sample MERFISH analysis pipeline, which combined cell segmentation, quality control (QC), graph-based clustering and mixed-effects differential expression. With this approach, we identified 1,488,870 cells across four samples (Fig. 3b), with a median of 36 transcripts and 24 genes per cell, annotated into 7 lineages (Fig. 3b, Extended Data Fig. 3a-c and Supplementary Table 1e). To better resolve the immune cell composition, we performed fine-grained clustering of lymphocytes and myeloid cells (Fig. 3b, Extended Data Fig. 3d-f and Supplementary Table 1f).
Fig. 3 ∣. MERFISH spatial analysis of gene expression in immunity hubs.

a, Schematic of MERFISH analysis. Tissue was manually annotated to include tumor areas, but exclude non-neoplastic areas, necrotic regions and tissue folds. Two non-mutually exclusive approaches were taken for analysis, assigning transcripts to: segmented cells (top) and tiles within a regular grid (bottom). Clustering analysis was performed for both tiles and cells. Furthermore, every cell could be uniquely assigned to one tile. b, Uniform manifold approximation and projection (UMAP) of coarse cell-type clusters (top) and finely clustered immune cells (bottom) from MERFISH data. Each dot represents one cell. For finely clustered immune cells, clusters are as follows: 1. LAMP3+CCL19+ mreg DC; 2. LAMP3+CD1C+ DC; 3. FLT3+ DC; 4. CD1C+ITGAX+ DC; 5. FCN1+LYZ+ myeloid; 6. CXCL10+ macrophage; 7. MARCO+ macrophage; 8. FOLR2+CD14+ macrophage; 9. MERTK+ macrophage; 10. MMP1+SOX4+ myeloid; 11. PLA2G7+CCL18+ macrophage; 12. SPP1+ macrophage; 13. NCAM1+100B+SEPP1+ myeloid; 14. B cells; 15. TCF7+CD4+ T cells; 16. TCF7+PD-1−CD8+ T cells; 17. Treg; 18. CXCL13+CD4+ T cells; 19. TCF7−CD8+ T cells; 20. CXCL13+CD8+ T cells; 21. Innate-like/γδ T cells; 22. Natural killer (NK); 23. TCF7−CD4+ T cells; 24. TCF7+PD-1+CD8+ T cells. c, UMAP showing Louvain clustering of tiles. d, List of differentially expressed genes and manual annotation of tile cluster identity. e, Heat map of tile clusters with differentially expressed genes. f–h, Scatterplots of logFC for abundance of TCF7+CD8+ T cells (defined as the combination of TCF7+PD-1+ and TCF7+PD-1−CD8+ T cell clusters) (f), TCF7+PD-1+CD8+ T cells (g) or CCL19 expression (h) versus CXCL9/CXCL10/CXCL11 expression for indicated tiles versus all other tiles. Tile cluster error bars colored red indicate significant enrichment (defined as FDR < 20% and logFC > 0) for CXCL9/CXCL10/CXCL11 (horizontal) or CCL19 (vertical). i, Expression of indicated genes for marker genes (left), chemokines (center) and other secreted factors (right) in indicated tile cluster groupings (as defined in d).
Next, we sought to identify the spatial neighborhoods where these cells may reside. We divided the tissue into 2,500-μm2 tiles (same tile area used for smFISH/IF; 69,097 total tiles; median 2,553 transcripts and 288 genes detected per tile) and applied Louvain clustering based on variable gene expression, revealing 14 tile clusters (Fig. 3c-e and Extended Data Fig. 4a,b), including: stem-immunity hubs (elevated CXCR3 ligands CXCL9/CXCL10/CXCL11, TCF7+CD8+ T cells, and TCF7+PD-1+CD8+ T cells; cluster t7; Fig. 3f,g), non-stem-immunity hubs (elevated CXCL9/CXCL10/CXCL11 but not enriched for TCF7+CD8+ T cells and TCF7+PD-1+CD8+ T cells; cluster t4; Fig. 3f,g), vascular hubs (expressing endothelial markers VWF and ERG and pericyte markers CSPG4 and GJA4; clusters t2 and t8; Fig. 3d), and all other regions, broadly labeled ‘tumor’ (t0, 1, 3, 5, 6, 9–13; see Supplementary Table 1g for comparison of four types of tile clusters and Extended Data Fig. 4c for their spatial distribution).
We sought to determine which chemokines and cytokines are present in stem-immunity hubs that might attract and support stem-like T cells (Supplementary Table 1g). This analysis revealed that, in addition to CXCL9/CXCL10/CXCL11, stem-immunity hubs were enriched for transcripts encoding the chemokine CCL19 and its receptor CCR7 (Fig. 3d,h). This result was consistent with previous reports showing that TCF7+PD-1+CD8+ T cells express CCR7 (refs. 25-27) and migrate in response to the CCR7 ligands CCL19/CCL21 (ref. 26). Stem-immunity hubs were also enriched for other T cell-attracting chemokines including CCL17, CCL22 and CCL5 (Fig. 3i). We noted increased expression of IL15 and IL12B in the stem-immunity versus tumor hubs, both of which may support T cell survival and differentiation28,29 (Fig. 3i). Consistent with higher density of activated immune cells, there was also increased expression of IFNG, TNF, IL2 and IDO1 in stem-immunity hubs relative to tumor hubs (Fig. 3i).
We then examined the cell-type composition of stem-immunity and non-stem-immunity hubs to identify the relevant multicellular networks involved in hub activity. Stem-immunity hubs were depleted in epithelial cells and enriched in vascular cells (Fig. 4a and Extended Data Figs. 1m and 4d,e), consistent with our observation that they were often found near the edge of the tumor (Extended Data Fig. 4c). Among myeloid cells in stem-immunity hubs, there were abundant CXCL10+ macrophages and enrichment for activated mature regulatory dendritic cells (mreg DCs; Fig. 4a-c, Supplementary Table 1h,i and Extended Data Fig. 4d,e), as defined by CCR7, IDO1 and LAMP3 expression30 (Extended Data Fig. 3f). We validated the enrichment of mreg DCs by directly visualizing these cells in a small 12-plex RNA-ISH staining cohort of three samples (Fig. 4d,e). We also observed depletion for SPP1+ macrophages (Extended Data Fig. 4d,e), which have been associated with fibrosis and poor patient outcomes31. Focusing on cytokines and chemokines, we found that the mreg DC population expressed CCL19, CCL17, CCL22, IL15 and IL12B (Fig. 4f and Supplementary Table 1f), consistent with published single-cell signatures2,30,32. Some chemokines were also expressed by T cells in stem-immunity hubs, including CCL5 and CXCL13 (Fig. 4f)19,33,34. These findings suggest that the stem-immunity hub is relatively spatially separated from tumor cells and well equipped with chemokines to organize the hub and DCs to interact with T cells35,36.
Fig. 4 ∣. MERFISH spatial analysis of lymphocyte and myeloid populations in immunity hubs.

a, log2 odds ratio (OR) enrichment of the abundance of indicated cell populations within hubs: stem-immunity versus tumor (x axis) or non-stem-immunity versus tumor (y axis) hubs. Indicated populations are significantly enriched (FDR < 20%, logOR > 0) in non-stem-immunity hub (teal), stem-immunity hub (blue) or both hub types (orange). b, Frequency of indicated cell types within stem-immunity and tumor tile neighborhoods. Each column represents the indicated patient. c, Representative mappings of stem-immunity hubs showing indicated cell types. d, Representative images of an area within a stem-immunity hub from the three samples stained with the 12-plex RNAscope panel. Left, CCL19 and CXCL10 expression in an area manually annotated as a stem-immunity hub using CD8A, TCF7 and CXCL10. Scale bar, 20 μm. Middle, mreg DCs were identified using CCR7 and IDO1 coexpression (white arrows). Right, Treg cells were identified using CD3E, FOXP3 and CD4 coexpression (white dashed circles), and were frequently directly adjacent to mreg DCs (white arrows). Similar images were observed for 76,284 cells in replicates from three donors. e, Densities of indicated cell types within the entire tumor area versus only within the stem-immunity hub for the three patient samples (patient nos. 43, 38 and 73) that were stained and analyzed in Halo. Two-sided paired t-test was performed. Nominal P values are shown. f, Expression of indicated genes by cell type within stem-immunity hubs.
Preferential myeloid–T cell interactions within stem-immunity hubs
To better understand cell–cell interactions in the stem-immunity hub, we asked which cells are colocalized with mreg DCs and CXCL10+ macrophages, as these cells produce chemokines (CXCL9/CXCL10/CXCL11, CCL19, CCL17/22; Fig. 4f) that may organize the stem-immunity hub. We found that mreg DCs were most frequently adjacent to TCF7+CD4+ T cells (false discovery rate (FDR) = 8.4 × 10⁻⁹) and regulatory T (Treg) cells (FDR = 1.0 × 10⁻⁷; Fig. 5, Extended Data Fig. 5 and Supplementary Table 1j). All enrichment statistics were found using mixed-effects regression and two-tailed analysis of variance (Methods), consistent with two independent reports37,38. We confirmed that these findings were not caused by segmentation artifacts by comparing the transcriptional profiles of these cell types based on their neighbors, which revealed overall similar gene expression profiles (Extended Data Fig. 6). We validated the preferential interaction of mreg DCs with TCF7+CD4+ T cells and Treg cells in our orthogonal validation 12-plex RNA-ISH staining (Extended Data Fig. 7). These data suggest that stem-immunity hubs might be sites for activation of CD4+ T cells as cytotoxic effectors39, helper T cells that may license DCs to activate CD8+ T cells40, or Tregs that may suppress this DC function38. CXCL10+ macrophages preferentially interacted with TCF7−CD8+ T cells within (FDR = 0.013; Fig. 5) and outside (Extended Data Fig. 5 and Supplementary Table 1j) stem-immunity hubs, in agreement with a recent study finding this pair of cells forming stable doublets by flow cytometry37. In further support of this association, we found preferential interaction of CXCL10+EPCAM− cells with TCF7−CD8+ T cells in our directly visualized validation 12-plex RNA-ISH staining (Extended Data Fig. 7). It is unknown how CXCL10+ macrophages affect CD8+ T cell state. Macrophages are major producers of CXCR3 ligands in the tumor microenvironment and that these ligands positively associate with CD8+ T cell infiltration and immunotherapy response7,41,42. However, macrophages have also recently been shown to promote CD8+ T cell exhaustion43,44, although it is not clear that these were CXCL10+ macrophages. Future research will address whether the same macrophage populations that recruit CD8+ T cells also exhaust them.
Fig. 5 ∣. Cell–cell interactions within stem-immunity hubs.

Neighboring cell analysis for cells within stem-immunity hubs. For each plot, the indicated cluster position (row) is held constant and enrichment with partner (column) is quantified versus scrambled distribution. Mean z-scores across all four samples are shown. Two-tailed P values were calculated from the mean z-scores and FDRs computed with the BH procedure across all P values. FDR < 0.05 are denoted with an asterisk. The total number of indicated index cells is shown on the right, based on Supplementary Table 1h.
Chemokine–receptor pairs in preferential myeloid–T cell interactions
We next asked which signaling pathways underpin cellular communication among LAMP3+CCL19+ mreg DCs and CXCL10+ macrophages with their respective colocalized lymphocyte populations. We used spatial ligand–receptor analysis, through the COMMOT algorithm45 and the CellChat3 database of curated ligand–receptor pairs, to infer statistically plausible signaling pathways between pairs of cell types inside stem-immunity niches. A major limitation of ligand–receptor analysis in MERFISH data is the limited gene panel, which contains only 221 of 945 genes present in the full CellChat database. To overcome this, we inferred gene expression values for all stromal and immune MER-FISH cells through Harmony integration with a lung cancer single-cell RNA-sequencing (scRNA-seq) atlas32 and k-nearest-neighbor smoothing (Methods). After filtering for well-expressed genes, present in >5% of cells, we performed COMMOT analysis on 682 ligand–receptor pairs, organized into 123 signaling pathways. To interpret the COMMOT results, we focused on pairs of cell types that were statistically significantly colocalized inside the stem-immunity hubs (Supplementary Table 1k). The result of ligand–receptor analysis yielded a list of putative signaling pathways between colocalized cell types, among which were chemokine–receptor interactions (Fig. 6). Consistent with their phenotype, CXCL10+ macrophages were enriched for interaction through the CXCL9/CXCL10/CXCL11–CXCR3 and CCL3/CCL4–CCR5 axes with CD8+ T cells (Fig. 6). Activated mreg DCs were found to utilize both the CCL17/CCL22–CCR4 axis and the CCL19–CCR7 axis to interact with Treg cells and TCF7+CD4+ T cells, respectively (Fig. 6), consistent with CCR4 and CCR7 expression on these T cell subtypes (Fig. 4f and Supplementary Table 1f). We did not observe a significant chemokine interaction between any myeloid cell and TCF7+PD-1+CD8+ T cells. Altogether, the stem-immunity hub contains two axes of myeloid–T cell interactions, mreg DCs with Treg cells/CD4+ T cells (likely through CCL17/CCL22–CCR4 and CCL19–CCR7) and CXCL10+ macrophages with CD8+ T cells (likely through CXCL9/CXCL10/CXCL11–CXCR3; Fig. 6).
Fig. 6 ∣. Non-random cell–cell interactions across tile neighborhood types.

Ligand–receptor analysis for myeloid cells (express ligands) and the indicated T cell types (express receptors). Colored boxes shown are the row-normalized COMMOT scores in stem-immunity hubs for significantly associated ligand–receptor interactions (permutation-based, one-sided, nominal P value < 0.05, gray boxes have nominal P value ≥ 0.05).
Stem-immunity hubs are enriched for CCL19+ fibroblasts
Given that stromal cells have diverse phenotypes, we sought to identify fine-grained clusters within our fibroblast and vascular MERFISH stromal populations (Fig. 3b) by integrating MERFISH stromal cells with cells from an independent scRNA-seq study of lung adenocarcinoma32 (Fig. 7a). Joint clustering identified pericytes, smooth muscle cells, three subtypes of endothelial cells and four subtypes of fibroblasts (Fig. 7b,c). Low quality MERFISH cells that could not be labeled were removed. Given that a bulk RNA-seq study observed that human lung cancer fibroblasts express CCL19 (ref. 46), we were intrigued to find CCL19 expression was highly enriched in one particular fibroblast subcluster (Fig. 7d) in both MERFISH data (log fold change (FC) = 9.4, adjusted P = 5.2 × 10⁻⁴; see generalized linear mixed-effects model (GLMM) in Methods) and the scRNA-seq reference, relative to other fibroblasts (logFC = 11.5, adjusted P = 5.6 × 10⁻⁵). To learn how the CCL19+ fibroblasts are spatially distributed among the four types of hubs, we calculated their enrichment in each hub and found that CCL19+ fibroblasts were significantly enriched (log2OR = 2.24, FDR = 0.03) in stem-immunity hubs (versus tumor) and not in vascular hubs (FDR = 1.00) or non-stem-immunity hubs (FDR = 0.83; Fig. 7e).
Fig. 7 ∣. Stem-immunity hubs contain CCL19+ fibroblasts.

a, UMAP of harmonized and co-embedded scRNA-seq32 and MERFISH stromal cells from human lung cancer. b,c, Clustering of high-quality, labeled MERFISH stromal cells presented as a UMAP (b) and a heat map (c) with differentially expressed genes. d, UMAP feature plot showing CCL19 expression within the stromal population. e, Number of CCL19+ fibroblasts per 2,500-μm2 tile in the indicated region types. Each dot represents the mean count per tile for the indicated patient sample. Open gray circle indicates the mean value. f, Neighboring cell analysis for cells within stem-immunity hubs, as in Fig. 5. g, Ligand–receptor analysis as in Fig. 6, but here presented for stromal cells (express ligands) and CD4+ T cells (express receptors). h, Graphical schematic of the stem-immunity hub. EC, endothelial cell.
To investigate interactions of the CCL19+ fibroblasts with other cells, we used index-based colocalization analysis with permutation-based P-value estimation (approach analogous to Fig. 5; Methods). Given that both mreg DCs and fibroblasts express CCL19, we hypothesized that they would interact with similar cells within stem-immunity hubs. Indeed, we found that both CCL19+ fibroblasts and mreg DCs colocalize with B cells and CD4+ T cells (FDR < 5%, Figs. 5 and 7f and Supplementary Table 1l. All enrichment statistics were found using mixed-effects regression and two-tailed analysis of variance). However, mreg DCs colocalized with Treg cells, whereas CCL19+ fibroblasts colocalized with several vascular cell subtypes (arterial endothelial cells, venous endothelial cells and pericytes). We interrogated ligand–receptor interactions between fibroblast subsets and CD4+ T cells and found the CCL19+ fibroblasts had significant CCL19–CCR7 interactions with CD4+ T cells (Fig. 7g). The CCL19+ fibroblasts additionally showed significant CCL21–CCR7 and CXCL12–CXCR4 interactions with CD4+ T cells, but other stromal cells such as lymphatic endothelial cells and IL6+ and RSPO3+ fibroblasts also scored for these chemokine interactions despite showing no preferential spatial colocalization with CD4+ T cells (Fig. 7f,g). Altogether, these data suggest that CCL19+ fibroblasts use CCL19 to recruit CD4+ T cells in stem-immunity hubs (Fig. 7h).
Stem-immunity hubs are enriched for ISGs relative to mature TLSs
Since tertiary lymphoid structures (TLSs) harbor TCF7+ cells47,48 and CCL19 expression49-51, we tested whether stem-immunity hubs were TLSs. TLSs are ectopic lymphoid aggregates visible by brightfield microscopy that develop in chronically inflamed tissue and mature to form B cell follicles and germinal centers52. To examine the presence of B cells, we stained sequential sections from six cases (non-responders = 2, responders = 4) using a new smFISH/IF panel including MS4A1 for B cells along with CXCL10/CXCL11, and PanCK. TCF7+ aggregates containing CXCL10/CXCL11+ cells (that is, stem-immunity hubs) lacked B cell follicles (Fig. 8a-c and Extended Data Figs. 8 and 9). These results suggest stem-immunity hubs are compositionally distinct from mature TLSs (because they lack B cell follicles). Importantly, in tissue regions identified as stem-immunity hubs (subcluster 3) in co-registered smFISH/IF panel 1 and 2 images (Fig. 2l), we noted CCL19 expression in the new smFISH panel (Fig. 8c), validating the MERFISH-based discovery that CCL19 expression is enriched in stem-immunity hubs (Fig. 3h).
Fig. 8 ∣. Expression of T cell and macrophage transcripts in stem-immunity hubs and TLSs.

a, Co-registered image of immunity hub subcluster 3 (from region in patient no. 53 denoted by box in Fig. 2j,l). Dashed ovals indicate areas with CXCL10/CXCL11+ cells. b, H&E-stained serial section from the area matched to that in a. c, Multiplexed RNA-ISH/IF image of serial section from area matched to that in a. Double arrowheads indicate CCL19+ cells. Arrows indicate CCL22+ cells. Images for the other five patient samples stained here are shown in Extended Data Fig. 8. d, Comparison of stem-immunity hub and TLS (as defined in Extended Data Fig. 9a) gene expression using GeoMx CTA assay. The volcano plot depicts pooled ROIs across all five samples. Each dot represents one gene. Dot coloring is as follows: blue, ISGs; green, myeloid genes; purple, T cell genes; orange, B cell genes.
To quantitatively examine differences between stem-immunity hubs and TLSs and orthogonally validate our MERFISH findings, we profiled the expression of ~1,800 genes in the Cancer Transcriptome Atlas (CTA) panel using spatially indexed transcriptomic analysis (GeoMx53) in five immunotherapy-naive primary human NSCLC tumor samples. Similarly to laser-capture microdissection, GeoMx enables gene expression readouts of user-defined spatial regions of interest (ROIs) using a programmable laser, ultraviolet-photocleavable barcodes, and a microfluidics system to transfer barcodes into a 96-well plate. Within each GeoMx slide, we used a combination of a nuclear stain and CXCL10 and CCL19 RNA smFISH probes to find cellular aggregates and define stem-immunity hubs (CXCL10+ CCL19+), non-stem-immunity hubs (CXCL10+CCL19−) and TLS-like structures (CXCL10−CCL19+, follicular morphology; see Extended Data Fig. 9a for criteria; average ROI area = 56,326 μm2; 238 total ROI profiled). While stem-immunity hubs are characterized by enrichment for CXCL10+ and TCF7+CD8+ T cells (Figs. 2g and 3e,f), we used CCL19 instead of TCF7+CD8+ T cells because of limited visualization marker plexity on the GeoMx microscope. Importantly, our previous MERFISH analysis showed that CXCL9/CXCL10/CXCL11 and CCL19 could faithfully mark stem-immunity hubs (Fig. 3h). Representative images of ROI types for each patient are shown in Extended Data Fig. 9b.
We identified differentially expressed genes between stem-immunity hubs and TLSs (Fig. 8d) and found that stem-immunity hubs were strongly enriched for the ‘Interferon Gamma Response’ gene set54 relative to TLSs (Supplementary Table 1m), including CXCL10 (used to select ROIs) and CXCL9 (not used to select ROIs). Stem-immunity hubs were also enriched for markers of activated CD8+ T cells (for example, CCL5, CD8A, CD2 and LAG3) and macrophages (for example, C1QA, C1QB, LYZ, CD14, CD68, CD163, S100A9, CCL18, CSF1R and TLR22). In contrast, TLSs were significantly enriched for B cell genes (for example, CD19, MS4A1, CR2, CD22, TNFRSF13C, BLK, CD79A and CD79B2) and modestly enriched for markers associated with less-differentiated lymphocyte states (TCF7, CCR7 and SELL2,13,55).
As expected from our GeoMx ROI selection strategy (Extended Data Fig. 9a), stem-immunity hubs expressed substantially more CCL19 than non-stem-immunity hubs (Extended Data Fig. 10a and Supplementary Table 1n). Consistent with our observation that stem-immunity hubs contained lymphoid aggregates, stem-immunity hubs were enriched in T and B cell markers associated with less-differentiated lymphocytes (TCF7, SELL, IL7R and CCR7; Extended Data Fig. 10a). In contrast, non-stem-immunity hubs were modestly enriched for a subset of ISGs and macrophage markers (Extended Data Fig. 10a). In addition to the comparison with stem-immunity hubs (Fig. 8d), we examined differentially expressed genes between non-stem-immunity hubs and TLSs using GeoMx (Extended Data Fig. 10b). Importantly, the definition of stem-immunity and non-stem-immunity hubs in our MERFISH and GeoMx datasets are in agreement based on concordant expression of 177 genes measured by both technologies (Extended Data Fig. 10c). Thus, the stem-immunity hub is distinct from the B cell-rich mature TLSs based on elevated levels of ISGs and genes marking macrophages and T cells.
Discussion
Our study found that the presence of immunity hubs predicts subsequent response to PD-1-blockade immunotherapy. Initially identified in MMRd CRC and here described in NSCLC, immunity hubs appear to be a generalized feature of immunogenic tumors, with clusters of CXCR3 ligand-expressing cells having also been identified in melanoma10,56 and breast cancer57. CXCR3 ligands and other ISGs such as STAT1 and MHC class II-related genes are critical for effective tumor immunity and were shown in numerous studies to be associated with PD-1-blockade responses in patients2,9,56-62.
We identify a new subset of these hubs, the stem-immunity hub, which was particularly associated with immunotherapy responsiveness in human lung tumors. Distinct from mature TLSs, the stem-immunity hub is defined by aggregates of TCF7+CD8+ T lymphocytes and the expression of the chemokines CXCL10/CXCL11 by macrophages and CCL19 by fibroblasts and mreg DCs.
The stem-immunity hub may be related to published reports of stem-like T cells within the tumor microenvironment, such as aggregates of stem-like CD8+ T cells that were observed near blood vessels, but away from tumors13,48. Additionally, signals from DCs within the tumor microenvironment have been shown to be sufficient to differentiate stem-like T cells (newly arrived from lymph nodes) into effector T cells63,64. Furthermore, intratumoral niches of TCF7+CD8+ T cells have been associated with a postoperative survival benefit in renal cell carcinoma65. However, it is unknown if those niches were enriched for other features of stem-immunity hubs such as CXCL9/CXCL10/CXCL11 and CCL19 expression and mreg DCs (Figs. 3h and 4a and Extended Data Fig. 3f).
The organization of the stem-immunity hub is reminiscent of the lymph node T cell regions (paracortex and interfollicular zone) with respect to cellular composition. In particular, the lymph node T cell regions not only house TCF7+ T cells, but also use CCL19 to position DCs and CXCL9/CXCL10 to position T cells66,67. Because mreg DCs within stem-immunity hubs are likely to be more enriched for tumor antigens compared to migrating DCs present in lymph nodes, the local tumor hubs could be superior to lymph nodes in expanding tumor-reactive PD-1+TCF7+ stem-like T cells. Conversely, the lymph node may specialize in preserving the most primordial tumor-reactive stem-like T cells64 before their exit to the periphery and entry into the tumor.
We speculate that stem-immunity hubs might develop from immunity hubs situated in permissive environments. For example, CXCR3-expressing T cells may be attracted into such immunity hubs, and it is known that T cells can express ligands (for example, LTα/β68,69 and LIGHT68) that signal through LTβR to induce CCL19 in fibroblasts70,71. Sufficient influx of activated T cells might thus initiate CCL19 expression in fibroblasts, thereby attracting CCR7+ mreg DCs, which themselves express CCL19 and other chemokines such as CCL17/CCL22. Importantly, lymphoid tissue inducer cells and B cells are also known to secrete LTβR ligands that modulate fibroblasts to express CCL19 in the formation of secondary lymphoid organs71,72. Future experimental studies are necessary to determine which cells orchestrate the formation of stem-immunity hubs. Whether immunity and stem-immunity hubs are transient or long-lived structures remains to be resolved.
Are there important subclasses of immunity hubs other than the stem-immunity hub? For example, we identify subcluster 1 as also enriched for T cells, particularly IFNG+ cells (Fig. 2g and Extended Data Fig. 1m). Perhaps this subclass is associated with effector function, but not with stem-like cells. Interestingly, subclusters 1 and 3 were often found in the same patients (Fig. 2b), raising the possibility of a connection between the two. We speculate that stem-immunity hubs might help expand tumor-specific effector T cells that may interact with tumor cells in subcluster 1.
In conclusion, our data support a central role for CXCL10/CXCL11-expressing immunity hubs in antitumor immunity and responsiveness to PD-1 blockade in patients with NSCLC. Furthermore, stem-immunity hubs represent a subclass of immunity hubs enriched for stem-like TCF7+PD-1+CD8+ T cells and CCL19, and are particularly associated with clinically beneficial responses. How the hubs change after treatment with checkpoint blockade remains unknown in NSCLC. However, reports from other cancers may offer clues. A recent study of neoadjuvant PD-1 blockade in hepatocellular carcinoma found that on-therapy resection specimens from responding patients had more frequent ‘triads’ of mreg DCs with stem-like CD8+ T cells and CXCL13+ CD4+ T cells relative to non-responders73. Overall, these multicellular networks in human lung cancer are promising candidates for predictive assays and represent potential therapeutic targets for cancer immunotherapy.
Methods
Patient cohort
FFPE whole-tissue sections from 68 patients with NSCLC treated with PD-1/PD-L1 inhibitor therapy at Massachusetts General Hospital (MGH) were retrospectively collected from the pathology archive. The cohort was 47% female (by biological sex listed in electronic medical record), with an average age of 69 years old, and 46% first-line therapy; additional baseline clinical and pathologic characteristics of the cohort are summarized in Supplementary Table 1a,b. Response to therapy was assessed using RECIST criteria (version 1.1)22. PFS was measured from the date of PD-1-blockade initiation to radiographic disease progression or death. OS was measured from the date of therapy initiation to the date of death. Patients still alive at the date of cutoff were censored (final data cutoff 7 February 2022; Supplementary Table 1b). Clinical immunohistochemistry for PD-L1 (Cell Signaling Technologies, clone E1L3N) was performed by the MGH Department of Pathology and evaluated as the percentage of tumor cells with any degree of PD-L1 expression, as previously described74. Pre-PD-1-blockade FFPE tissue specimens were retrieved from the MGH Department of Pathology clinical archive and evaluated for presence of tumor by a board-certified pathologist (J.H.C.) and a minimal evaluable tumor area of 0.5 mm2. Patients were not excluded on the basis of biological sex, gender, race or ethnicity. Patients were all 18 years of age or older. All samples in the MGH pathology archive meeting these inclusion criteria as of January 2020 were used (n = 68). Patients went on to receive PD-1-blockade monotherapy, except for patient no. 42, who received PD-1-blockade plus chemotherapy. Sections (5 μm) were cut by the MGH Histopathology Research Core facility onto standard positively charged slides. This study was conducted under MGH Institutional Review Board protocol no. 2019P002829 (excess tissue from routine clinical practice for lung cancer) and Dana-Farber Harvard Cancer Center Institutional Review Board protocol no. 02-240 (informed consent protocol used for staining controls). We have complied with all relevant ethical regulations in conducting this study. Patients were not compensated for participation.
Tissue staining
Tissue sections were stained with Leica Bond RX automated stainer using unlabeled primary antibodies and tyramide signal amplification-based Opal fluorophores (Akoya Biosciences). The RNA smFISH/IF panel also used RNAscope ISH probes (Advanced Cell Diagnostics). Reagents are described in Supplementary Table 1p. The construction of the RNA smFISH/IF panel has been described2. The IF-only panel was constructed in accordance with the Akoya Phenoptics Opal Assay Development Guide (October 2017). Primary antibodies were titrated in tonsil and lung cancer tissue. Multiplex staining used the Opal 7-Color Automation IHC Kit (NEL821001KT, Akoya Biosciences). For PD-1 and PD-L1 staining, Powervision Poly-HRP anti-Rabbit IgG (PV6119, Leica Biosystems) at a 1:10 dilution was used because of superior signal-to-background performance. Fluorophore concentrations were selected based on balancing signal intensity across neighboring channels. The absence of bleedthrough was confirmed by fluorescence-minus-one experiments. Importantly, fluorophores were selected for maximum compatibility with the MOTIF setting on the Akoya PhenoImager, which allows for the use of fluorophores that are widely spectrally separated. Once the staining panel was locked, samples were run in batches of 10–18 slides. Each run contained a mixture of responder and non-responder samples to protect against the possibility of staining batch effects confounding the analysis. A tonsil slide was included in all batches as a control. For the RNA smFISH/IF panel, a DNA MMRd colon cancer slide was also included as a control2.
Image acquisition
Whole-slide images were acquired on an Akoya PhenoImager multi-spectral slide scanner at ×20 (0.5 μm) resolution. Spectral unmixing was performed using inForm (v2.4, Akoya Biosciences). The inForm unmixing library was constructed using single-color control tonsil slides (CD20 or DAPI) and an unstained lung cancer slide for autofluorescence control. Cell segmentation and quantification was performed using Indica Labs Halo software on tumor regions identified by a board-certified pathologist (J.H.C.). Areas within tumor regions containing low-quality regions such as folds, necrosis or staining artifacts were excluded from the analysis. For display images in figures, individual channel view settings were adjusted in Halo so that all channels were clearly visible in the merged images. These adjustments were unrelated to image analysis (described in the subsequent section).
Cell-phenotype enumeration
Image analysis was performed blinded to response status. Cell segmentation and phenotyping of whole-slide images from 68 patients was performed using the FISH-IF v.1.2.2 Halo module for the RNA smFISH/IF panel and using the HighPlex FL v3.2.1 Halo module for the IF-only panel. Nucleus-based cell segmentation was performed using DAPI. The cell boundary was delineated by dilating nuclear objects to 2–3 μm.
For the IF-only panel, cells were phenotyped based on intensity thresholds and percentage coverage of stain within the nuclear and cytoplasmic compartments. Percentage coverage was utilized to minimize effects of intensity overlap from bright neighbors. Cells were considered positive for a particular phenotype (for example, CD8) if there was positivity in either compartment. For the nuclear factors, TCF7 and Ki67, only the nuclear intensity was used to determine positivity.
For the RNA smFISH/IF panel, cell positivity for ISH markers was set using criteria for stain intensity and size, where brighter and larger RNA dots were given more weight. All markers were required to be negative for autofluorescence. For both panels, analyzed samples were manually checked for quality of phenotyping. To assess for false positive calls, 100 cells called positive for a given phenotype were manually reviewed to confirm they were true positives. Particular emphasis was placed on the cells that were just above the minimum threshold for a positive call (although we chose not to analyze our positive cells by intensity substratification beyond this QC threshold; the analysis software outputs intensity values by default). To assess for false negative calls, 100 cells called negative were similarly checked. Additionally, cells visually appearing positive were checked for consistency of calls. This approach was performed for all markers for each case. Object tables containing individual cell information from all cell phenotyping analyses were exported for further analysis using the R programming language.
Combined panels
Matched serial sections from 46 patients stained from the two panels (RNA smFISH/IF and IF only) were co-registered using Halo (Indica Labs) software. The 22 samples that could not be co-registered were generally small and/or had regional architecture substantially different between the two slides, which made finding a registerable region of tumor impossible. Landmarks were identified in each image to ensure good alignment of tumor regions. Merged images underwent cell segmentation using the machine learning default AI module in Halo software. Cell phenotyping was performed using the FISH-IF v.2.1.5 Halo module for the RNA-ISH/IF panel and using the HighPlex FL v4.1.3 Halo module for the IF-only panel. All object tables were exported for analysis in R.
Unbiased window identification
A computationally fast window approach was used to explore the local tissue microenvironment, where cell phenotypes were enumerated within a 50 × 50-μm window. This window size was chosen based on the empirical observation that CXCL10/CXCL11+ immunity hubs were as small as 100 μm across. These windows contained a median of 25 cells. We reasoned that making windows smaller might result in too few cells per window (that is, capturing only the CXCL10/CXCL11+ cells would not provide meaningful information about the immunity hubs). At the same time, we reasoned that making windows bigger could result in dilution of hub signal because large windows would do a poor job of contouring the smaller immunity hubs.
Windows were included if they contained at least 7 cells for unregistered images and 15 cells for registered images. Then, an unbiased k-means clustering was applied across all windows using the CXCL10/CXCL11+ cell fraction (of all cells within a window). Windows that were enriched in CXCL10/CXCL11+ cells grouped into cluster 2 (that is, immunity hub windows), while windows that had little to no CXCL10/CXCL11+ cells were assigned to cluster 1. An analogous approach was taken for PanCK−TCF7+ cells. Immunity hub windows were overlaid onto a map of the tissue allowing visual inspection of these regions.
Window combination and t-SNE analysis
Our windowing approach divided large areas enriched in CXCL10/CXCL11+ cells into multiple immunity hub windows. Therefore, adjacent CXCL10/CXCL11+ windows were combined to facilitate a compositional analysis more reflective of the integrative biology across the entirety of the immunity hub. This allows us to capture a community of interacting cells that span multiple grid windows. An immunity hub is defined as two or more CXCL10/CXCL11+ windows that are adjacent and each had greater than 7 cells (15 cells for the two co-registered images). For the 68 co-registered images, we had the following total counts: 1,330,963 total windows (of which 1,144,589 had >7 cells), 22,028 CXCL10/CXCL11+ windows (of which 20,387 had >7 cells) and 14,139 CXCL10/CXCL11+ windows in the 3,777 aggregates. For the 46 co-registered images, we had the following total counts: 865,900 total windows (of which 688,172 had >15 cells), 15,963 CXCL10/CXCL11+ windows (of which 14,083 had >15 cells) and 9,939 CXCL10/CXCL11+ windows in the 2,712 aggregates. Each hub was assigned a unique identifier. For each immunity hub, cell phenotypes were enumerated, and the area was computed. For each patient sample, immunity hubs were mapped back onto a plot of the tissue section for visual inspection. A similar aggregation approach was taken for defining TCF7+ aggregates. However, because TCF7+ aggregates were generally a few hundred micrometers across (larger than the stem-immunity hubs), the search radius for agglomeration of grid windows was expanded to 100 μm. Each aggregate was required to be composed of two or more PanCK−TCF7+ neighboring windows and each window to have a minimum of 35 cells.
Paired plots were generated comparing phenotype density in immunity hubs compared to total tumor area (both immunity hub and non-immunity hub). BH-adjusted P values for the paired Wilcoxon test were calculated (four phenotypes compared in RNA panel and seven in antibody panel).
To explore cell-phenotype composition within the 2,712 immunity hubs, we performed unsupervised clustering analysis on the hubs using the Rtsne package (approach adapted from ref. 75). Cell-phenotype counts per hub area were scaled based on the global maximum for each phenotype and used to create t-SNE coordinates. Twenty-one cell-phenotype features were used in the analysis: CD3E+, CD8+, Ki67+CD8+, PD-1+ CD8+, PD-1 +Ki67+CD8+, PD-1+TCF7+CD8+, TCF7+CD8+, CD8+TCF7+Ki67+CD8+, PanCK+ (IF-only panel), PanCK+PD-L1+ , PanCK+TCF7+, PanCK−PD-L1+, PanCK−TCF7+, PanCK+ (RNA smFISH/IF panel), PanCK+CXCL10/CXCL11+, PanCK−CXCL10/CXCL11+, CXCL10/CXCL11+, IFNG+, PD-1+, PD-L1+ and total cell density. The optimal number of principal components for variance explained was identified as six by scree plot. Thereafter, a t-SNE dimensionality reduction was performed using Rtsne, with perplexity set to 50. To identify subclusters, the t-SNE coordinates were used to create an edge list for a fast k-nearest-neighbor search algorithm with the maximum number of nearest neighbors equal to 50. Next, distances were converted to weights such that greater weight was given to smaller neighbor distances. A Leiden clustering algorithm76 was then applied using the modularity method with the resolution parameter set to 0.25, yielding seven Leiden subclusters. The subclusters were mapped back onto a tissue plot for closer inspection of cell phenotypes in these regions. Plots were also generated showing subclusters present within each patient image and the cell-phenotype composition per subcluster. P values were adjusted for multiple-hypothesis testing using the BH method.
Computation was performed in R using the packages tidyverse, data.table, Rtsne, FNN, igraph, stats, ggpubr, Rstatix, factoextra, gridExtra, ggforce, RColorBrewer and survminer.
GeoMx
We chose five cases that featured stem-immunity, non-stem-immunity and TLS-like structures on the same slide. In addition to one case from our 68-patient cohort (patient no. 43), we identified four additional NSCLC cases in the MGH archives meeting these criteria (patient nos. 69, 70, 71 and 72). Slides were prepared using the semiautomated protocol as described in the manufacturer-supplied protocol (NanoString, MAN-10151-01). FFPE tissue sections (5 μm) were baked at 65 °C for 2 h. We visualized CXCL10 (Advanced Cell Diagnostics, 311858-C2), CCL19 (Advanced Cell Diagnostics, 474368-C4) and EPCAM (Advanced Cell Diagnostics, 310288-C3) expression using RNAscope probes to inform ROI selection. RNAscope probes amplified Cy3 (for visualization of CXCL10; Perkin Elmer, FP1046; 1:1,500 dilution), Cy5 (for visualization of CCL19; Perkin Elmer, FP1171; 1:3,000 dilution) and Alexa Fluor 594 (for visualization of EPCAM, Thermo Fisher, B40957; 1:300 dilution) by tyramide amplification. A nuclear marker (Syto13, NanoString, 121300303) was also visualized. Slides were profiled using the NanoString GeoMx CTA (NanoString, 121400101) and the Human TCR Alpha v1 panels in parallel.
Slides were loaded onto the GeoMx and scanned at ×20 magnification (following NanoString MAN-10152-01). ROIs were manually selected as described in Extended Data Fig. 9a. In total, we collected 86 stem-immunity hub, 78 TLSs and 74 immunity hub ROIs across all patients. Library preparation was performed as described in the manufacturer-supplied protocol (NanoString, MAN-10153-01), and sequencing was performed on the NextSeq 500 platform.
GeoMx data were analyzed using the R packages NanoStringNCTools, GeomxTools and GeoMxWorkflows (https://bioconductor.org/). For CTA analyses, NanoString barcode counts were Q3 normalized (as described in the manufacturer-supplied protocol; NanoString, MAN-10154-01) for each ROI across all genes by patient. A mixed-effects model was used to construct the volcano plots in Fig. 8 and Extended Data Fig. 10a,b to account for slide-to-slide batch effects. CTA GSEA77 was performed using the R package fgsea (https://bioconductor.org/), which calculates adjusted P values and the Hallmark gene sets54.
12-plex RNA-ISH
For the 12-plex validation assay, we used the RNAscope HiPlex v2 assay (user manual 324409). We performed three cycles of staining, imaging and stripping on standard 5-μm tissue sections. Our panel contained the following markers: IDO1, CCR7, FOXP3, CD4, PDCD1, CCL22, EPCAM, CCL19, CD8A, CXCL10, CD3E and TCF7 (Supplementary Table 1o). We stained and analyzed samples from a small cohort of three patients with NSCLC (nos. 38, 73 and 43), chosen because they had sufficiently low FFPE tissue autofluorescence that made it feasible to set exposure times long enough to capture RNA-ISH fluorescence signal. This was important because, although this 12-plex HiPlex assay allows for a greater number of probes than the 4-plex RNAscope, it accomplishes this by dispensing with the covalent tyramide signal amplification chemistry used in the 4-plex assay. Slides were imaged using the Akoya PhenoImager slide scanner at ×20 magnification (0.5 μm) with the binning feature enabled. After imaging of the third staining cycle was completed, an additional cycle of stripping and imaging was completed to verify the efficiency of stripping.
QPTIFF images were imported into Halo software for analysis. Tumor and QC annotation was performed manually in Halo as in the 4-plex assay. Stem-immunity hub regions were annotated by the presence of CXCL10+ and TCF7+CD8A+ cells. Cell segmentation and phenotyping was performed using FISH-IF v.2.1.5 Halo. Nucleus-based segmentation was performed using default AI, based on the DAPI from the third imaging round. The cell boundary was delineated by dilating the nuclear object to 2 μm. Cell positivity for ISH probes was based on the manually defined minimum signal intensity threshold. All markers were required to be negative for autofluorescence. All T cells were defined by expression of CD3E. Treg cells were identified by the presence of FOXP3, CD3E and CD4. Mreg DCs were defined by high expression of both CCR7 and IDO1. Analyzed samples were manually checked for quality of phenotyping.
MERFISH data generation
A MERSCOPE Gene Panel was designed using Vizgen’s Gene Panel Design Portal (https://portal.vizgen.com/). Briefly, a total of 484 genes were selected based on marker genes that commonly identify immune, stromal and epithelial cells and expression programs in scRNA-seq datasets (for example, ref. 2). In total, 479 genes were assigned with a binary barcode for MERFISH imaging, while the remaining 5, due to their high expression level in cells, were imaged through sequential rounds of smFISH (Supplementary Table 1q).
We selected among PD-1-blockade responder cases based on whether they contained stem-immunity hubs and preference was given to blocks containing more tumor tissue to optimize for the number of cells per MERFISH run. Three of the cases were from the original cohort and the fourth was a newer case (no. 73) that became available after analysis of the original 68-patient cohort was complete. FFPE human lung cancer samples were sectioned into 5-μm slices using a microtome and placed onto a 40-mm-diameter round MERSCOPE Slide. After drying at 55 °C for 15 min, the tissue slices were deparaffinized and rehydrated by incubating in 100% ethanol, 90% ethanol and 70% ethanol, for 5 min each. The samples were then de-crosslinked with heat-induced antigen retrieval at 90 °C for 15 min. Tissue sections were then blocked with Cell Boundary Blocking Buffer (Vizgen, PN 20300012) for 1 h, stained with primary antibody mix (Vizgen, PN 20300010) diluted in Blocking Buffer at 1:100 for 1 h and then secondary antibody mix from Cell Boundary Staining Kit (Vizgen, 20300011) for 1 h. The sample was gel embedded, cleared and hybridized with the MERSCOPE Gene Panel Mix at 37 °C for 36–48 h by following Vizgen’s MERSCOPE FFPE Sample Preparation User Guide (https://vizgen.com/resources/merscope-formalin-fixed-paraffin-embedded-tissue-sample-preparation-user-guide/). Samples were washed twice with 5 ml Formamide Wash Buffer at 47 °C for 30 min, before staining with DAPI and Poly T (Vizgen, 20300021) for 15 min and washed with Formamide Wash Buffer at room temperature, away from light. Sample imaging was conducted on the MERSCOPE Platform (Vizgen, 10000001).
MERFISH supervised tissue ROI selection
Output MERFISH images were reviewed using MERSCOPE Visualizer software and referenced against H&E sections. Low-quality areas (for example, necrosis, tissue detachment and/or imaging artifact) were excluded from analysis. All tile and cell analyses described below were restricted to these high-quality neoplastic regions.
MERFISH cell-type segmentation
We performed cell segmentation using a combination of CellPose78 and Baysor79 algorithms. The CellPose algorithm was used to estimate cell shapes based on DAPI and a proprietary IF cell surface marker cocktail (MERSCOPE user guide 91600112 revision B). Individual transcripts contained within the boundaries of CellPose segmented cells were assigned to their respective cells, while all others were assigned to background. We then used these initial cell assignments as the prior segmentation estimate for Baysor, an algorithm designed to identify cells in MERFISH data based on the spatial density of transcripts. We used the authors’ Julia implementation of Baysor (https://github.com/kharchenkolab/Baysor; version 0.5.1) with the following parameters: min-molecules-per-segment = 2, min-pixels-per-cell = 15, scale-std = ‘100%’, iters = 500, new-component-fraction = 0.3, prior-segmentation-confidence = 0.7, min-molecules-per-gene = 1, min-molecules-per-cell = 3, n-clusters = 1, new-component-weight = 0.2. For all other parameters, we used default values provided by the software. To run Baysor efficiently on our large datasets, we divided each image into tiles with at most 2,000,000 transcripts each, ran Baysor individually on each tile and pooled the results from each tile into a global list of cells for each image.
MERFISH cell-type labeling
We used a custom pipeline to analyze the individual cells segmented with the strategy above. We first performed QC, removing all cells with fewer than ten total transcripts. We then normalized and variance stabilized the read counts per cell by normalizing read counts to a fixed depth, adding 1 and applying the log transform. For the fixed depth, we used median total counts over all cells in the dataset, after QC filtering. We then performed a balanced principal component analysis (PCA), as described in Korsunsky et al.80, giving equal weight to each of the four datasets and to each region type (defined below). To account for batch effects, we used Harmony, with parameter theta = 0.5, to correct for the effect of dataset identity on cells’ PCA embeddings. We then estimated a weighted nearest-neighbor graph of the cells in harmonized PC space and used the graph to estimate a two-dimensional UMAP embedding with the R uwot package81, using parameters min_dist = 0.01 and spread = 0.22. We used the same graph to partition the cells by maximum modularity with the Leiden algorithm76, as implemented in the R igraph package82. We next identified cluster markers with differential expression analysis. To account for variable read depth and batch effects, we fit a Poisson GLMM for each gene with the formula y_g ~ 1 + (1∣cluster) + (1∣cluster:batch) + (1∣batch) + offset(logUMI). To do this, we used the presto-GLMM package (https://github.com/immunogenomics/presto/tree/glmm/), which wraps GLMM estimation from lme4 (ref. 83) with random-effect posterior variance estimation from arm84 to estimate the logFC and its variance of each gene in one cluster versus all other clusters. Finally, coarse-grained cell-type labels were assigned to each cluster based on known lineage markers. We computed P values for each level of random effects using posterior simulation (arm package) to compute estimator variance and Wald’s test to compute z-scores based on the estimated posterior mean and variance.
We repeated this full pipeline to subtype non-plasma lymphocytes and myeloid cells, which were difficult to disentangle in the initial coarse-grained clustering analysis of all cells. To protect against unwanted variation from contaminating transcripts, we removed genes that were significantly overexpressed (logFC > 0, P < 0.05) in epithelial cells, fibroblasts, mast cells, plasma cells or vascular cells and not overexpressed (logFC < 0) in either lymphocyte or myeloid clusters in the coarse-grained marker analysis. We found that this strategy gave more emphasis to gene variation arising from intrinsic cell identity rather than confounding variation arising from neighboring cells or other forms of noise. Because we used a limited gene panel in this analysis, we performed an additional QC filtering step and removed cells within insufficient (<10 total transcripts) information. These cells were not given a fine-typed label and marked as poor-quality cells. On the remaining high-quality cells, we performed normalization, PCA, Harmony integration, clustering and differential expression as described above. To ensure that we had clustered to a sufficient resolution, we checked that each top cluster marker was uniformly expressed throughout the cells in that cluster. Clusters whose top markers were expressed heterogeneously were further divided into subclusters using the same modularity clustering algorithm described above. Finally, a small number of clusters expressed marker genes associated with two cell types and could not be further subdivided to split cells into the two cell types. We labeled these cells as doublets and removed them from the final annotation.
We labeled stromal cells with a modified pipeline. Because stromal cells tend to have irregular shapes, they also suffer from more segmentation errors and thus contain more erroneous transcripts from adjacent cells. To account for these errors, we anchored stromal cell fine typing in a matched scRNA-seq dataset32. We first analyzed the scRNA-seq dataset alone, using only the 479 genes in our MERFISH panel. After QC, normalization, PCA, clustering and cluster marker analysis, we assigned fine-grained types to the scRNA-seq fibroblasts, pericytes and endothelial cells. We then selected 174 genes that best differentiated different stromal fine types from one another, with P < 0.05 and logFC > 0. Using these 174 genes, we performed a joint analysis of scRNA-seq and MERFISH stromal cells. We integrated the two datasets using Harmony85, integrating over both the technology variable (that is, MERFISH versus scRNA-seq) and the intra-technology batch variables. After Harmony, we performed label transfer from labeled scRNA-seq cells to unlabeled MERFISH cells by clustering all cells in the Harmonized embedding and assigning cluster labeling based on the majority of scRNA-seq cells in each cluster.
MERFISH tissue segmentation and labeling
We performed unbiased tissue segmentation using a combination of grid-based binning and clustering analyses. We first divided each image into 2,500-μm2 hexagon tiles and assigned transcripts to their respective overlapping tiles. To enforce smoothness in the gene expression profiles of neighboring tiles, we also added transcripts within 15 μm of a tile’s boundary to that tile. Note that with this strategy, one transcript may be assigned to up to three neighboring tiles. We then analyzed tiles using the clustering pipeline described in ‘MERFISH cell-type labeling’ as follows: remove low-read tiles, normalize read counts with log(1 + CP − median), PCA, Harmony, modularity clustering and GLMM-based differential expression. We identified tile clusters based on differential expression of known markers for stem-immunity hubs, non-stem-immunity hubs and the vascular cluster (Fig. 3d-h). All remaining tile clusters were labeled ‘tumor’. We next combined adjacent tiles with the same cluster labels into larger aggregates using deterministic graph partitioning based on weakly connected components using the igraph package82. We allowed for some uncertainty in tile label assignment by connecting similar tiles that were not directly adjacent but whose borders were within 50 μm of each other. We then pooled all transcripts from tiles inside an aggregate to define that aggregate’s gene expression profile. Final hub-type markers were computed using GLMM-based differential expression on these aggregate gene expression profiles.
MERFISH colocalization analysis
Within each type of immunity hub, we analyzed the spatial organization of cells. Specifically, we asked whether two cells were physically adjacent to one another more often than expected by chance. To do this, we isolated all cells assigned to the same type of hub (for example, stem-immunity) and identified their physically adjacent cells using Delaunay triangulation86. This strategy defined adjacent cells as cells whose centroids are within 30 μm of each other with no other cells located between their centroids. For each cell, which we will refer to as the index cell, we counted the number of neighbors of each type (for example, 2 CD T cells, 1 B cell and 0 all others). We then tested, for each pair of cell types, whether one cell type (for example, CD4+ T cells) is more abundant in the neighborhood of another cell type (for example, mreg DCs) than expected by chance. To estimate the significance of the colocalization frequency of two cell types, we used spatial permutation, motivated by the approach of Keren et al.87. Our strategy is as follows: fix the location of the index cell type, permute other cell-type labels within spatial aggregates (as defined in ‘MERFISH tissue segmentation and labeling’) 1,000 times, compute the frequency of colocalization between index and other cell types under these random permutations, compute a variance for colocalization frequencies based on the null distribution from permutation colocalization frequencies and, finally, use the variance to estimate a two-sided z-score for the observed colocalization frequency statistic. This permutation strategy is important for two reasons. First, it accounts for different densities of cell types, since more frequent cell types will have higher colocalization frequency, even under the spatial independence null model. Second, by permuting cell labels within aggregates only, we condition on the cell-type composition of each aggregate. In practice, this approach resulted in better calibrated P values. We derived statistical significance of colocalization frequencies using spatial permutation within spatial hubs, defined earlier as aggregates of adjacent tiles. This strategy did not work with our ‘tumor’ region category, because the tumor regions were large and often spanned whole pieces of tissue. Spatial permutation works on spatially constrained regions and yields inflated P values when applied to large regions. The intuition behind these inflated statistics is that spatial permutation is meant to test shuffling of labels in nearby cells. When we are allowed to shuffle labels of cells across the whole tissue (as in the tumor region), this assumption is broken and the null distribution is misspecified. We note that the calculation of colocalization is unlikely secondary to false positive T cell attribution because T cells have similar cell-type signatures irrespective of whether they touch a CXCL10+ macrophage or mreg DC (Extended Data Fig. 6).
MERFISH cell with hub association testing
We tested the differential abundance of cell types within hub types to find which cell types are depleted and which are more abundant in which hub type (for example, mreg DCs in stem-immunity). To do this, we used each spatial aggregate, instead of individual tiles, as an independent observation, to ameliorate the confounding effect of spatial autocorrelation. Within each aggregate, we computed the average density of cell types as the average number of cells per tile. We then used linear mixed-effects regression with lme4 (ref. 83) to compare the relative density of each cell type between two hub types. We fit a null model (density ~ 1 + (1∣batch/hubType)) and an alternative model (density ~ 1 + hubType + (1∣batch/hubType)) and computed the significance of the fixed effect with a likelihood-ratio test between the alternative and null models. In these formulas, hubType is a two-level categorical variable that represents the two hub types we are testing (for example, stem-immunity versus tumor). In the null model, we allow each library to have a different baseline density for a cell type and to have its own differential abundance between hub types. Thus, the likelihood-ratio test will only be significant if the differential abundance is shared by multiple datasets and not only present in one or two.
MERFISH spatial ligand–receptor analysis
We used the COMMOT algorithm45 to infer ligand–receptor interactions between neighboring cells within stem-immunity hubs. We limited ourselves to interactions between cells whose centroids are within 100 μm of each other. We also collapsed dimers into individual genes in the CellChat database. All other parameters in COMMOT were set to default values.
Per the suggested usage, we first inferred signaling scores within individual cells and then inferred statistically significant interactions, through spatially constrained permutation testing, between pairs of cell types. To make computation scalable, we performed COMMOT inside each stem-immunity hub separately. We then summarized the interaction scores and P values using inverse-variance-weighted meta-analysis, to generate a single result for every pair of interacting cell types.
Statistical tests and data assumptions
We made our best efforts to use statistical tests that were most appropriate to the data throughout the paper. For gene expression count analysis, we used mixed-effects Poisson regression, to account for confounding random effects and accurately model discrete gene counts. In spatial colocalization analyses and ligand–receptor analyses, we used permutation tests to ensure an empirically sound prior. For every two-group comparison with Wilcoxon rank-sum test and t-tests, data were assumed to be normal, but this was not formally tested. In visual representations of these two-group data, we showed the full distribution of the data, either by including all data points, if possible, or with a one-dimensional Gaussian density estimation curve.
Extended Data
Extended Data Fig. 1 ∣. Leiden clustering of immunity hubs.

(a–d) Paired RNA smFISH/IF and IF only stained slides were coregistered for 46 of the patients. PanCK staining is shown in cyan for RNA smFISH/IF and magenta for IF panel images. (e–g) tSNE projection as in Fig. 2a colored by (E) patient ID, (F) patient response status, and (G) immunity hub size. (h) Patient composition within each immunity hub Leiden subcluster. (i) Plot as in (H), but the y-axis depicts the number of subclusters, colored by the patient. Each column is a Leiden subcluster. (j) Frequency of immunity hub subclusters expressed as a fraction of total tumor area for responders and non-responders (NR = 33 and R = 13 patients). Two-sided Mann-Whitney test p-value is shown. (k-l) Kaplan-Meier analysis of progression-free survival (PFS) and overall survival (OS) for each subcluster. Patients were classified as either above or below a threshold of 0.1% of total tumor area for each subcluster. Shown p-values are adjusted for multiple hypothesis testing (7 tests) using the Benjamini-Hochberg method (J-L). (m) Counts of indicated phenotypes within immunity hubs, as in Fig. 2g. Phenotype counts were normalized by immunity hub area and scaled from 0-1. Each point represents the mean value across all immunity hubs of a given Leiden subcluster for each patient having that subcluster (number of patients having subcluster: #1 = 18, #2 = 33, #3 = 31, #4 = 11, #5 = 27, #6 = 25, and #7 = 30). Boxplots are defined as follows: center line = median, box minima and maxima = interquartile range (IRQ), and whiskers = 1.5*IQR. Statistical comparison was performed using an unpaired two-sided Mann-Whitney test relative to subcluster 3. Benjamini-Hochberg adjusted p-values shown: ns = not significant, *p < 0.05, **p < 0.01, ***p < 0.001, and ****p < 0.0001. (n) Fraction of TCF7+PD1+ CD8 T cells found within subcluster 3 in responders versus non-responders. Each dot represents one patient (NR = 33 and R = 13 patients). Two-sided Mann-Whitney test p-value is shown. (o) Counts of contact (at least touching in a cardinal direction) between TCF7+ aggregates and subcluster 3 immunity hubs versus other immunity hub subclusters (subclusters 1-2 and 4-7). Statistical comparison was performed using a two-sided Fisher’s exact test.
Extended Data Fig. 2 ∣. Representative images for each immunity hub subcluster.

Each row features an immunity hub from a different patient among the 46 patients with successfully coregistered panels. Aligned serial sections are shown for RNA ISH/IF panel (Column A), H&E (Column B), and IF only panel (Columns C-G). (a) IFNG+ cells (circles) are observed in immunity hubs. (b) H&E shows immunity hubs contain immune infiltrate abutting neoplastic cells. (c) Ki67+CD8+ (circles) and Ki67+TCF7+CD8+ cells (arrows) are found. (d) Ki67+TCF7+CD8+ (arrows), TCF7+CD8+ (circles), and TCF7+PD1+CD8+ cells (arrowheads) are found. (e) PD1+CD8+ (circles) and TCF7+PD1+CD8+ cells (arrowheads) are found. (f) Composite image showing indicated channels. (g) PD-L1+ cells are found.
Extended Data Fig. 3 ∣. Cell-based clustering identifies many immune cell types in MERFISH data.

(a) Histogram of transcripts per cell by patient. (b) UMAP of MERFISH data from Fig. 3b, colored by patient. (c) Cell counts by coarse cell type for each patient. (d) UMAP of immune cell MERFISH data from Fig. 3b, colored by patient. (e) Cell counts for fine immune clustering for each patient. (f) Heatmap including both coarse and fine cell clusters versus expression of key marker genes.
Extended Data Fig. 4 ∣. Cell-based analysis of MERFISH data reveals cell populations enriched within the stem-immunity hubs.

(a) The tile grid consisted of regular hexagons with area = 2500 μm2. To improve smoothness in tile clustering, hexagonal tiles were dilated with a 15 μm buffer. (b) Transcripts per non-dilated 2500 μm2 tile by patient. (c) Spatial map of tumor for four MERFISH samples, with tiles colored by four region types. (d) Mean number of cells per tile per aggregate for indicated clusters. Each dot represents one patient, colored by patient number. The open gray circle represents the mean cell per tile count for all aggregates of the indicated tile type across patients. (e) Forest plots depict the log2 odds ratio of the abundance (normalized to physical area) of a cell type in the indicated region type versus abundance in library-matched tumor areas. Error bars denote the 95% confidence interval (n = 4 patients, as in (D)) and center dot denotes point estimate.
Extended Data Fig. 5 ∣. Co-localization of cells.

(a) Neighboring cell analysis for cells within stem-immunity hubs, as in Fig. 5. For each plot, indicated cluster position (row) is held constant and enrichment with partner (column) is quantified versus scrambled distribution. Mean z-scores across all four samples are shown. Two-tailed p-values were calculated from the mean z-scores and FDRs computed with the Benjamini-Hochberg procedure across all p-values. FDR < 0.05 are denoted with an asterisk. Total number of indicated index cells is shown at right, based on Supplementary Table 1,h. (b) Absolute frequency of interactions (mean of the mean frequencies across the four samples) for a given index cell (row) and partner cell type (column). (c) The red line on histograms shows how frequently specific T cell types are observed to neighbor the indicated myeloid cell type within the stem-immunity hubs for indicated patients. Gray bars denote random distribution (expected distribution based on cell type frequency).
Extended Data Fig. 6 ∣. Gene signatures of T cells neighboring mreg DCs and CXCL10+ macrophages.

Heatmap of gene expression of CD4 T cells, CD8 T cells, and Tregs, subdivided into three groups reflecting their neighborhood composition: adjacent to at least one LAMP3+CCL19+ mreg DC, adjacent to at least one CXCL10+ macrophage, or adjacent to neither. T cells adjacent to both were rare and thus not included in this analysis. Only genes significantly differentially overexpressed (GLMM adj. p < 0.05 & logFC > 0.5, see Methods) in one of the rows are shown.
Extended Data Fig. 7 ∣. Cell-cell interactions within stem-immunity hubs.

Neighboring cell analysis for cells within stem-immunity hubs based on 12-plex RNAscope data. For each plot, indicated cluster position (row) is held constant and enrichment with partner (column) is quantified versus scrambled distribution. Z-scores were calculated from the mean and standard deviation of the permutation-based empirical null distribution. Mean z-scores across all four samples are shown. Two-tailed p-values were calculated from the mean z-scores and FDRs computed with the Benjamini-Hochberg procedure across all p-values. FDR < 0.05 are denoted with an asterisk.
Extended Data Fig. 8 ∣. TCF7+ regions feature CCL19, CCL22, and variable MS4A1, and frequently overlap with immunity hub subcluster 3.

(a–c) Six cases (R = 4, NR = 2) from the 68 patient cohort with TCF7+ aggregates (smFISH/IF panel staining shown in B) were stained by H&E (C) and an additional panel for CCL19, CCL22, MS4A1, CXCL10/11, and PanCK. Dashed ovals indicate areas with CXCL10/11+ cells. Arrows point to CCL22+ cells.
Extended Data Fig. 9 ∣. Representative NanoString GeoMx regions of interest.

(a) Fluorescently labeled RNA smFISH probes for CXCL10 and CCL19 on GeoMx slides guided region of interest (ROI) selection for transcriptional profiling. Histological features, region location, and number of regions profiled are noted. (b) Representative GeoMx images of stem-immunity (SI) hub, non-stemimmunity hub, and TLS ROI (as defined in (A)) for all five patients profiled using Nanostring GeoMx. White lines indicate ROI boundaries. ROI ID number for a given patient is indicated in the top left corner of each image.
Extended Data Fig. 10 ∣. Transcriptional profile of stem-immunity hubs, non-stem-immunity hubs, and TLS using GeoMx.
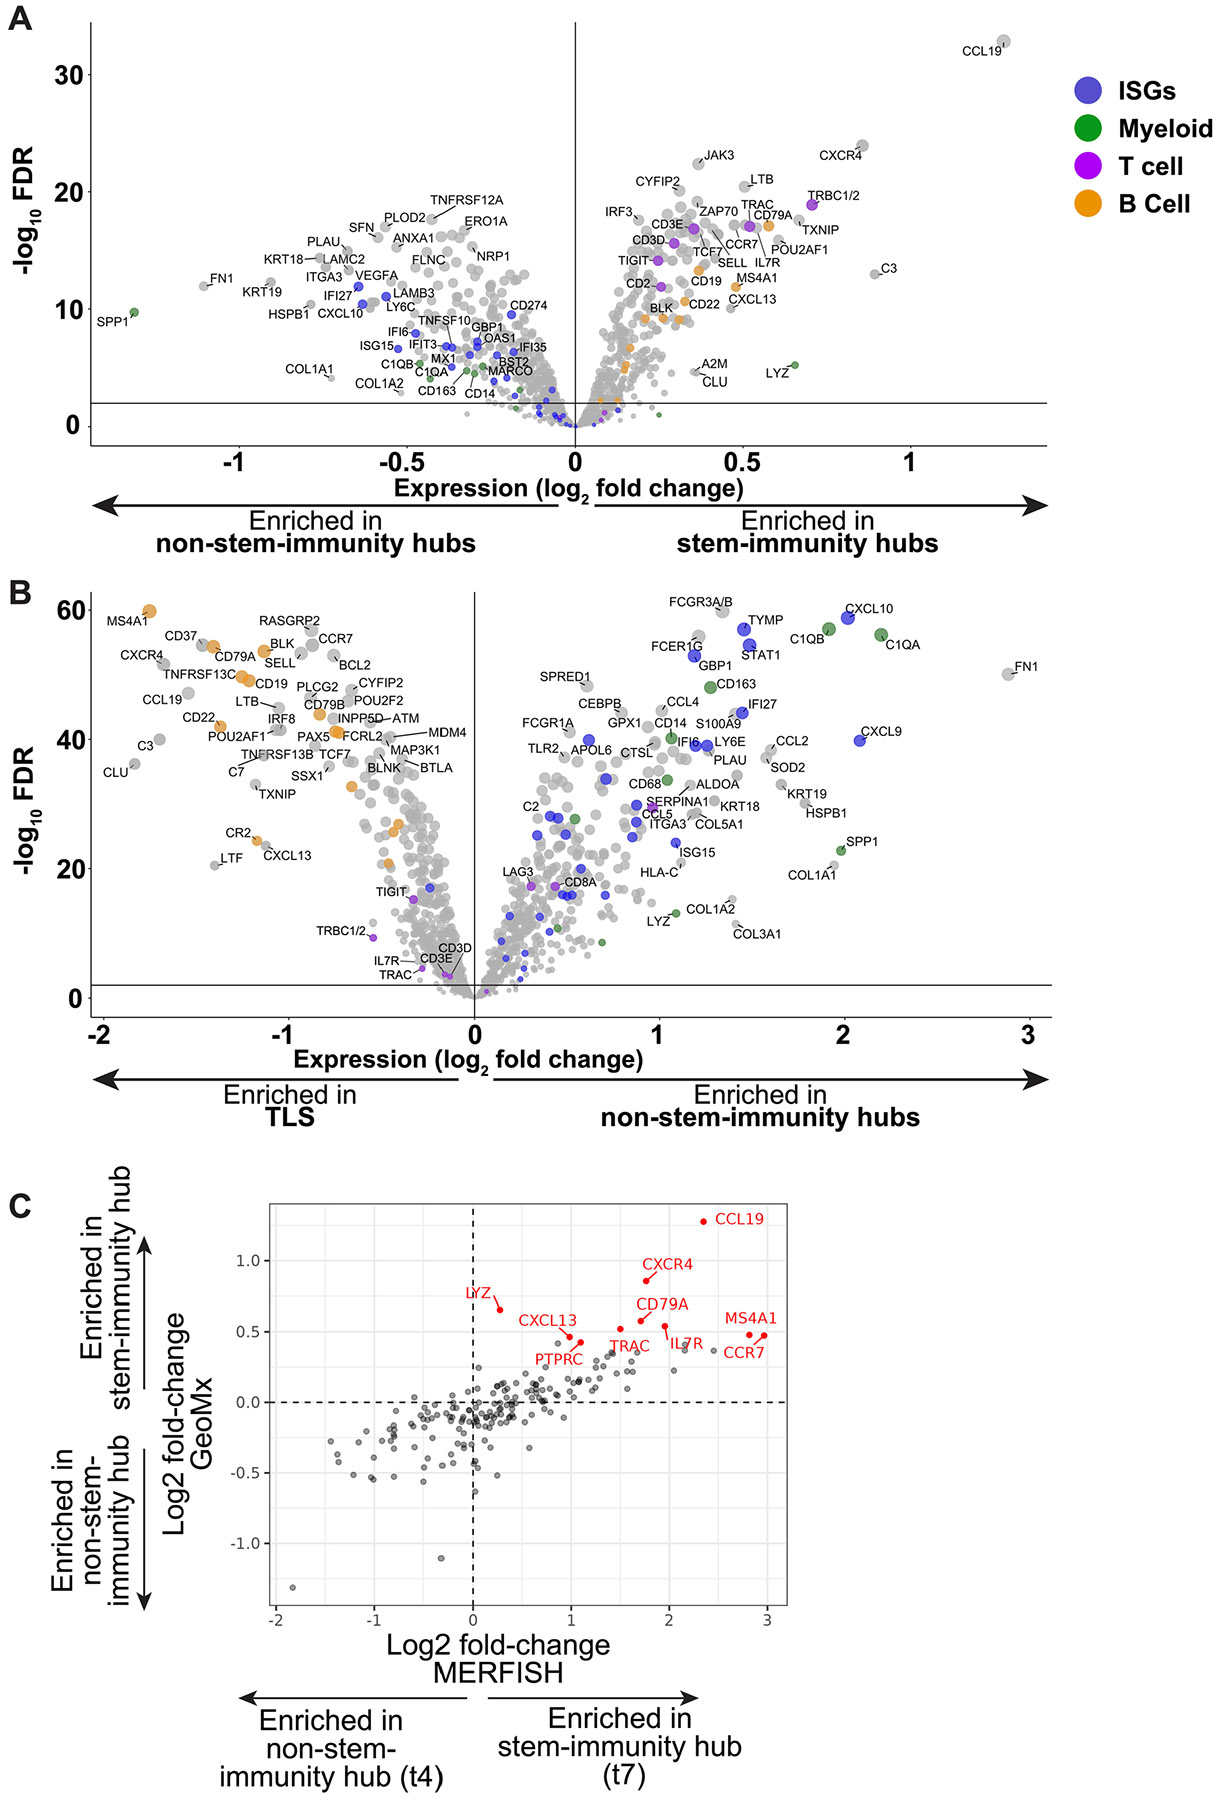
(a, b) Comparison of (A) stem-immunity hub and non-stem-immunity hub and (B) non-stem-immunity hub and TLS gene expression using GeoMx CTA assay. Volcano plots depict pooled ROIs across all 5 samples. Each dot represents one gene. Dot coloring is as follows: blue - ISGs, green - myeloid genes, purple - T cell genes, and orange - B cell genes. (c) Scatter plot of expression for 177 genes included in both GeoMx and MERFISH panels for manually annotated stem-immunity hubs (GeoMx) and tile cluster-defined stem-immunity hubs (t7, MERFISH) (pearson correlation r = 0.78, p < 1E-35). Axes indicate log2 fold-change of gene expression in stem-immunity versus non-stem-immunity hub. Each dot denotes one gene. Red dots denote the top 10 over-expressed genes in stem-immunity (versus non-stem-immunity hub) in the GeoMx dataset.
Supplementary Material
Acknowledgements
We thank the MGH Cancer Center Translational Imaging Core, MGH Pathology Department, members of the MGH spatial transcriptomics group and members of the laboratory of N.H. We thank S. X. Chao and D. Lieb for assistance with MERFISH panel design and creation of a Single Cell Portal page for the MERFISH data, respectively. This work was made possible by the generous support from Novartis as part of the MGH–Novartis Alliance. ACD donated the 12-plex RNAscope reagents as part of their Spatial Validation Program award to J.H.C. This work was also supported by public funds from the National Institutes of Health/National Cancer Institute iNCI 1T32CA207021 (to J.H.C.), 1K08CA273547-01A1 (to J.H.C.) and R00CA259511 (to K.P.), institutional funds from the MGH Fund for Medical Discovery (to J.H.C.), MGH Krantz Stewardship (to J.H.C.) and UROP funds from Massachusetts Institute of Technology (to A.L.T.) and private funds from the SU2C Phillip A. Sharp Award SU2C-AACR-PS-32 (to K.P. and N.H.), Mark Foundation for Cancer Research (to N.H.), SITC/AstraZeneca Forward Fund (to J.H.C.), Happy Lungs Foundation (to J.F.G.) and the BWH-Broad Institute Collaborative Research Award (to I.K. and N.H.). N.H. is the David P. Ryan, MD Endowed Chair in Cancer Research, a gift from Arthur, Sandra and Sarah Irving.
Footnotes
Online content
Any methods, additional references, Nature Portfolio reporting summaries, source data, extended data, supplementary information, acknowledgements, peer review information; details of author contributions and competing interests; and statements of data and code availability are available at https://doi.org/10.1038/s41590-024-01792-2.
Reporting summary
Further information on research design is available in the Nature Portfolio Reporting Summary linked to this article.
Competing interests
J.H.C. receives research support from the Society for Immunotherapy of Cancer AstraZeneca fellowship and a sponsored research agreement with Calico labs and previously with Novartis. J.H.C. consults for Merck and has also received a speaking honorarium from the Society for Interventional Oncology and has non-paid technology materials transfer agreements with NanoString and Vizgen. M. Spurrell owns equity in Novo Nordisk. M.P. consults for Third Rock Ventures. C.S.N. holds equity in Opko Health and receives royalties from Life Technologies and Cambridge Epigenetix. S.F.’s salary is partially supported by research funding from IBM. A.M. has served in a consultant/advisory role for Third Rock Ventures, Asher Biotherapeutics, Abata Therapeutics, ManaT Bio, Flare Therapeutics, venBio Partners, BioNTech, Rheos Medicines and Checkmate Pharmaceuticals, is currently a part-time Entrepreneur in Residence at Third Rock Ventures, is an equity holder in ManaT Bio, Asher Biotherapeutics and Abata Therapeutics, and has received research funding support from Bristol Myers Squibb. M.S.-F. receives funding from Bristol Myers Squibb. G.M.B. has sponsored institutional research agreements with Olink Proteomics, Teiko Bio, InterVenn Biosciences and Palleon Pharmaceuticals. G.M.B. served on advisory boards for Iovance, Merck, Nektar Therapeutics, Novartis and Ankyra Therapeutics. G.M.B. consults for Merck, InterVenn Biosciences, Iovance and Ankyra Therapeutics. G.M.B. holds equity in Ankyra Therapeutics. M.J.A has financial and consulting interests unrelated to this work in SeQure Dx and Chroma Medicine. M.M.-K. has served as a consultant for AstraZeneca, BMS, Sanofi and Janssen Oncology and receives royalties from Elsevier. J.F.G. has consulted and/or had advisory roles for Agios, Amgen, AstraZeneca, Array BioPharma, Blueprint Medicines Corporation, BMS, Genentech/Roche, Gilead Sciences, Jounce Therapeutics, Lilly, Loxo Oncology, Merck, Mirati, Silverback Therapeutics, Sanofi, GlydeBio, Curie Therapeutics, Novartis, Moderna Therapeutics, Oncorus, Regeneron, Takeda and Pfizer; has stock and ownership in Ironwood Pharmaceuticals; and has received Honoraria from Merck, Novartis, Pfizer and Takeda; and institutional research funding from Adaptimmune, ALX Oncology, Merck, Array BioPharma, AstraZeneca, Blueprint Medicines Corporation, BMS, Scholar Rock, Genentech, Jounce Therapeutics, Merck and Novartis; research funding from Novartis, Genentech/Roche and Takeda, and has an immediate family member who is an employee of Ironwood Pharmaceuticals. N.H. holds equity in and advises Danger Bio/Related Sciences, is on the scientific advisory board of Repertoire Immune Medicines and CytoReason, owns equity and has licensed patents to BioNtech, and receives research funding from Bristol Myers Squibb and Calico Life Sciences. J.H., N.F.F. and G.E. are employees of Vizgen. C.P. (now at Takeda) was an employee of Vizgen when this research was conducted. J.W.R. and K.V.R. are employees of NanoString. I.K. receives research funding from the Chan Zuckerberg Initiative and has consulting/advisory roles with Mestag Therapeutics and Scailtye. The remaining authors declare no competing interests.
Extended data is available for this paper at https://doi.org/10.1038/s41590-024-01792-2.
Supplementary information The online version contains supplementary material available at https://doi.org/10.1038/s41590-024-01792-2.
Data availability
MERFISH data are available at https://singlecell.broadinstitute.org/single_cell/study/SCP2510/human-lung-cancer-harbors-spatially-organized-stem-immunity-hubs-that-associate-with-response-to-immunotherapy#study-summary/. All other data are available in the article and Supplementary Information or from the corresponding authors upon reasonable request.
Code availability
Code is available at https://github.com/korsunskylab/nsclc_manuscript_2023/.
References
- 1.Le DT et al. PD-1 blockade in tumors with mismatch-repair deficiency. N. Engl. J. Med 372, 2509–2520 (2015). [DOI] [PMC free article] [PubMed] [Google Scholar]
- 2.Pelka K et al. Spatially organized multicellular immune hubs in human colorectal cancer. Cell 184, 4734–4752 (2021). [DOI] [PMC free article] [PubMed] [Google Scholar]
- 3.Mihm MC Jr. & Mulé JJ Reflections on the histopathology of tumor-infiltrating lymphocytes in melanoma and the host immune response. Cancer Immunol. Res 3, 827–835 (2015). [DOI] [PMC free article] [PubMed] [Google Scholar]
- 4.Angell HK, Bruni D, Barrett JC, Herbst R & Galon J The immunoscore: colon cancer and beyond. Clin. Cancer Res 26, 332–339 (2020). [DOI] [PubMed] [Google Scholar]
- 5.Thommen DS et al. A transcriptionally and functionally distinct PD-1+ CD8+ T cell pool with predictive potential in non-small-cell lung cancer treated with PD-1 blockade. Nat. Med 24, 994–1004 (2018). [DOI] [PMC free article] [PubMed] [Google Scholar]
- 6.Moldoveanu D et al. Spatially mapping the immune landscape of melanoma using imaging mass cytometry. Sci. Immunol 7, eabi5072 (2022). [DOI] [PubMed] [Google Scholar]
- 7.Litchfield K et al. Meta-analysis of tumor- and T cell-intrinsic mechanisms of sensitization to checkpoint inhibition. Cell 184, 596–614 (2021). [DOI] [PMC free article] [PubMed] [Google Scholar]
- 8.Cristescu R et al. Pan-tumor genomic biomarkers for PD-1 checkpoint blockade-based immunotherapy. Science 362, eaar3593 (2018). [DOI] [PMC free article] [PubMed] [Google Scholar]
- 9.Ayers M et al. IFN-γ-related mRNA profile predicts clinical response to PD-1 blockade. J. Clin. Invest 127, 2930–2940 (2017). [DOI] [PMC free article] [PubMed] [Google Scholar]
- 10.Reschke R et al. Immune cell and tumor cell-derived CXCL10 is indicative of immunotherapy response in metastatic melanoma. J. Immunother. Cancer 9, e003521 (2021). [DOI] [PMC free article] [PubMed] [Google Scholar]
- 11.Sade-Feldman M et al. Defining T cell states associated with response to checkpoint immunotherapy in melanoma. Cell 175, 998–1013 (2018). [DOI] [PMC free article] [PubMed] [Google Scholar]
- 12.Krishna S et al. Stem-like CD8 T cells mediate response of adoptive cell immunotherapy against human cancer. Science 370, 1328–1334 (2020). [DOI] [PMC free article] [PubMed] [Google Scholar]
- 13.Siddiqui I et al. Intratumoral Tcf1+PD-1+CD8+ T cells with stem-like properties promote tumor control in response to vaccination and checkpoint blockade immunotherapy. Immunity 50, 195–211 (2019). [DOI] [PubMed] [Google Scholar]
- 14.Kurtulus S et al. Checkpoint blockade immunotherapy induces dynamic changes in PD-1-CD8+ tumor-infiltrating T cells. Immunity 50, 181–194 (2019). [DOI] [PMC free article] [PubMed] [Google Scholar]
- 15.Miller BC et al. Subsets of exhausted CD8+ T cells differentially mediate tumor control and respond to checkpoint blockade. Nat. Immunol 20, 326–336 (2019). [DOI] [PMC free article] [PubMed] [Google Scholar]
- 16.Reck M et al. Pembrolizumab versus chemotherapy for PD-L1-positive non-small-cell lung cancer. N. Engl. J. Med 375, 1823–1833 (2016). [DOI] [PubMed] [Google Scholar]
- 17.Liu B, Zhang Y, Wang D, Hu X & Zhang Z Single-cell meta-analyses reveal responses of tumor-reactive CXCL13+ T cells to immune-checkpoint blockade. Nat. Cancer 3, 1123–1136 (2022). [DOI] [PubMed] [Google Scholar]
- 18.Caushi JX et al. Transcriptional programs of neoantigenspecific TIL in anti-PD-1-treated lung cancers. Nature 596, 126–132 (2021). [DOI] [PMC free article] [PubMed] [Google Scholar]
- 19.Oliveira G et al. Phenotype, specificity and avidity of antitumour CD8+ T cells in melanoma. Nature 596, 119–125 (2021). [DOI] [PMC free article] [PubMed] [Google Scholar]
- 20.Lowery FJ et al. Molecular signatures of antitumor neoantigen-reactive T cells from metastatic human cancers. Science 375, 877–884 (2022). [DOI] [PMC free article] [PubMed] [Google Scholar]
- 21.Hanada K-I et al. A phenotypic signature that identifies neoantigen-reactive T cells in fresh human lung cancers. Cancer Cell 40, 479–493 (2022). [DOI] [PMC free article] [PubMed] [Google Scholar]
- 22.Eisenhauer EA et al. New response evaluation criteria in solid tumours: revised RECIST guideline (version 1.1). Eur. J. Cancer 45, 228–247 (2009). [DOI] [PubMed] [Google Scholar]
- 23.Groom JR & Luster AD CXCR3 in T cell function. Exp. Cell. Res 317, 620–631 (2011). [DOI] [PMC free article] [PubMed] [Google Scholar]
- 24.Chen KH, Boettiger AN, Moffitt JR, Wang S & Zhuang X RNA imaging. Spatially resolved, highly multiplexed RNA profiling in single cells. Science 348, aaa6090 (2015). [DOI] [PMC free article] [PubMed] [Google Scholar]
- 25.Wu T et al. The TCF1–Bcl6 axis counteracts type I interferon to repress exhaustion and maintain T cell stemness. Sci. Immunol 1, eaai8593 (2016). [DOI] [PMC free article] [PubMed] [Google Scholar]
- 26.Im SJ et al. Defining CD8+ T cells that provide the proliferative burst after PD-1 therapy. Nature 537, 417–421 (2016). [DOI] [PMC free article] [PubMed] [Google Scholar]
- 27.Eberhardt CS et al. Functional HPV-specific PD-1+ stem-like CD8 T cells in head and neck cancer. Nature 597, 279–284 (2021). [DOI] [PMC free article] [PubMed] [Google Scholar]
- 28.Lee J et al. IL-15 promotes self-renewal of progenitor exhausted CD8 T cells during persistent antigenic stimulation. Front. Immunol 14, 1117092 (2023). [DOI] [PMC free article] [PubMed] [Google Scholar]
- 29.Xue D et al. A tumor-specific pro-IL-12 activates preexisting cytotoxic T cells to control established tumors. Sci. Immunol 7, eabi6899 (2022). [DOI] [PMC free article] [PubMed] [Google Scholar]
- 30.Maier B et al. A conserved dendritic-cell regulatory program limits antitumour immunity. Nature 580, 257–262 (2020). [DOI] [PMC free article] [PubMed] [Google Scholar]
- 31.Qi J et al. Single-cell and spatial analysis reveal interaction of FAP+ fibroblasts and SPP1+ macrophages in colorectal cancer. Nat. Commun 13, 1742 (2022). [DOI] [PMC free article] [PubMed] [Google Scholar]
- 32.Kim N et al. Single-cell RNA sequencing demonstrates the molecular and cellular reprogramming of metastatic lung adenocarcinoma. Nat. Commun 11, 2285 (2020). [DOI] [PMC free article] [PubMed] [Google Scholar]
- 33.Song A, Nikolcheva T & Krensky AM Transcriptional regulation of RANTES expression in T lymphocytes. Immunol. Rev 177, 236–245 (2000). [DOI] [PubMed] [Google Scholar]
- 34.Li H et al. Dysfunctional CD8 T cells form a proliferative, dynamically regulated compartment within human melanoma. Cell 176, 775–789 (2019). [DOI] [PMC free article] [PubMed] [Google Scholar]
- 35.Dubois SP, Waldmann TA & Müller JR Survival adjustment of mature dendritic cells by IL-15. Proc. Natl Acad. Sci. USA 102, 8662–8667 (2005). [DOI] [PMC free article] [PubMed] [Google Scholar]
- 36.Di Pilato M et al. CXCR6 positions cytotoxic T cells to receive critical survival signals in the tumor microenvironment. Cell 184, 4512–4530 (2021). [DOI] [PMC free article] [PubMed] [Google Scholar]
- 37.Cohen M et al. The interaction of CD4+ helper T cells with dendritic cells shapes the tumor microenvironment and immune checkpoint blockade response. Nat. Cancer 3, 303–317 (2022). [DOI] [PubMed] [Google Scholar]
- 38.Rapp M et al. CCL22 controls immunity by promoting regulatory T cell communication with dendritic cells in lymph nodes. J. Exp. Med 216, 1170–1181 (2019). [DOI] [PMC free article] [PubMed] [Google Scholar]
- 39.Oh DY et al. Intratumoral CD4+ T cells mediate anti-tumor cytotoxicity in human bladder cancer. Cell 181, 1612–1625 (2020). [DOI] [PMC free article] [PubMed] [Google Scholar]
- 40.Lei X et al. CD4+ helper T cells endow cDC1 with cancer-impeding functions in the human tumor micro-environment. Nat. Commun 14, 217 (2023). [DOI] [PMC free article] [PubMed] [Google Scholar]
- 41.House IG et al. Macrophage-derived CXCL9 and CXCL10 are required for antitumor immune responses following immune checkpoint blockade. Clin. Cancer Res 26, 487–504 (2020). [DOI] [PubMed] [Google Scholar]
- 42.Chow MT et al. Intratumoral activity of the CXCR3 chemokine system is required for the efficacy of anti-PD-1 therapy. Immunity 50, 1498–1512 (2019). [DOI] [PMC free article] [PubMed] [Google Scholar]
- 43.Nixon BG et al. Tumor-associated macrophages expressing the transcription factor IRF8 promote T cell exhaustion in cancer. Immunity 55, 2044–2058 (2022). [DOI] [PMC free article] [PubMed] [Google Scholar]
- 44.Kersten K et al. Spatiotemporal co-dependency between macrophages and exhausted CD8+ T cells in cancer. Cancer Cell 40, 624–638 (2022). [DOI] [PMC free article] [PubMed] [Google Scholar]
- 45.Cang Z et al. Screening cell-cell communication in spatial transcriptomics via collective optimal transport. Nat. Methods 20, 218–228 (2023). [DOI] [PMC free article] [PubMed] [Google Scholar]
- 46.Cheng H-W et al. CCL19-producing fibroblastic stromal cells restrain lung carcinoma growth by promoting local antitumor T-cell responses. J. Allergy Clin. Immunol 142, 1257–1271 (2018). [DOI] [PubMed] [Google Scholar]
- 47.Peng Y et al. Single-cell profiling of tumor-infiltrating TCF1/TCF7+ T cells reveals a T lymphocyte subset associated with tertiary lymphoid structures/organs and a superior prognosis in oral cancer. Oral. Oncol 119, 105348 (2021). [DOI] [PubMed] [Google Scholar]
- 48.Im SJ et al. Characteristics and anatomic location of PD-1+TCF1+ stem-like CD8 T cells in chronic viral infection and cancer. Proc. Natl Acad. Sci. USA 120, e2221985120 (2023). [DOI] [PMC free article] [PubMed] [Google Scholar]
- 49.Rangel-Moreno J, Moyron-Quiroz JE, Hartson L, Kusser K & Randall TD Pulmonary expression of CXC chemokine ligand 13, CC chemokine ligand 19, and CC chemokine ligand 21 is essential for local immunity to influenza. Proc. Natl Acad. Sci. USA 104, 10577–10582 (2007). [DOI] [PMC free article] [PubMed] [Google Scholar]
- 50.Sato Y et al. Heterogeneous fibroblasts underlie age-dependent tertiary lymphoid tissues in the kidney. JCI Insight 1, e87680 (2016). [DOI] [PMC free article] [PubMed] [Google Scholar]
- 51.Sautès-Fridman C, Petitprez F, Calderaro J & Fridman WH Tertiary lymphoid structures in the era of cancer immunotherapy. Nat. Rev. Cancer 19, 307–325 (2019). [DOI] [PubMed] [Google Scholar]
- 52.Schumacher TN & Thommen DS Tertiary lymphoid structures in cancer. Science 375, eabf9419 (2022). [DOI] [PubMed] [Google Scholar]
- 53.Merritt CR et al. Multiplex digital spatial profiling of proteins and RNA in fixed tissue. Nat. Biotechnol 38, 586–599 (2020). [DOI] [PubMed] [Google Scholar]
- 54.Liberzon A et al. The Molecular Signatures Database (MSigDB) hallmark gene set collection. Cell Syst. 1, 417–425 (2015). [DOI] [PMC free article] [PubMed] [Google Scholar]
- 55.Wherry EJ et al. Molecular signature of CD8+ T cell exhaustion during chronic viral infection. Immunity 27, 670–684 (2007). [DOI] [PubMed] [Google Scholar]
- 56.Hoch T et al. Multiplexed imaging mass cytometry of the chemokine milieus in melanoma characterizes features of the response to immunotherapy. Sci. Immunol 7, eabk1692 (2022). [DOI] [PubMed] [Google Scholar]
- 57.Schulz D et al. Simultaneous multiplexed imaging of mRNA and proteins with subcellular resolution in breast cancer tissue samples by mass cytometry. Cell Syst. 6, 25–36 (2018). [DOI] [PMC free article] [PubMed] [Google Scholar]
- 58.Ardighieri L et al. Infiltration by CXCL10 secreting macrophages is associated with antitumor immunity and response to therapy in ovarian cancer subtypes. Front. Immunol 12, 690201 (2021). [DOI] [PMC free article] [PubMed] [Google Scholar]
- 59.Alspach E et al. MHC-II neoantigens shape tumour immunity and response to immunotherapy. Nature 574, 696–701 (2019). [DOI] [PMC free article] [PubMed] [Google Scholar]
- 60.Tumeh PC et al. PD-1 blockade induces responses by inhibiting adaptive immune resistance. Nature 515, 568–571 (2014). [DOI] [PMC free article] [PubMed] [Google Scholar]
- 61.Ryan N et al. STAT1 inhibits T-cell exhaustion and myeloid derived suppressor cell accumulation to promote antitumor immune responses in head and neck squamous cell carcinoma. Int. J. Cancer 146, 1717–1729 (2020). [DOI] [PMC free article] [PubMed] [Google Scholar]
- 62.Meissl K, Macho-Maschler S, Müller M & Strobl B The good and the bad faces of STAT1 in solid tumours. Cytokine 89, 12–20 (2017). [DOI] [PubMed] [Google Scholar]
- 63.Prokhnevska N et al. CD8+ T cell activation in cancer comprises an initial activation phase in lymph nodes followed by effector differentiation within the tumor. Immunity 56, 107–124 (2023). [DOI] [PMC free article] [PubMed] [Google Scholar]
- 64.Huang Q et al. The primordial differentiation of tumor-specific memory CD8+ T cells as bona fide responders to PD-1/PD-L1 blockade in draining lymph nodes. Cell 185, 4049–4066 (2022). [DOI] [PubMed] [Google Scholar]
- 65.Jansen CS et al. An intra-tumoral niche maintains and differentiates stem-like CD8 T cells. Nature 576, 465–470 (2019). [DOI] [PMC free article] [PubMed] [Google Scholar]
- 66.Grant SM, Lou M, Yao L, Germain RN & Radtke AJ The lymph node at a glance–how spatial organization optimizes the immune response. J. Cell Sci 133, jcs241828 (2020). [DOI] [PMC free article] [PubMed] [Google Scholar]
- 67.Duckworth BC & Groom JR Conversations that count: cellular interactions that drive T cell fate. Immunol. Rev 300, 203–219 (2021). [DOI] [PMC free article] [PubMed] [Google Scholar]
- 68.Gommerman JL & Browning JL Lymphotoxin/light, lymphoid microenvironments and autoimmune disease. Nat. Rev. Immunol 3, 642–655 (2003). [DOI] [PubMed] [Google Scholar]
- 69.Piao W et al. Regulatory T cells condition lymphatic endothelia for enhanced transendothelial migration. Cell Rep. 30, 1052–1062 (2020). [DOI] [PMC free article] [PubMed] [Google Scholar]
- 70.Dejardin E et al. The lymphotoxin-beta receptor induces different patterns of gene expression via two NF-κB pathways. Immunity 17, 525–535 (2002). [DOI] [PubMed] [Google Scholar]
- 71.Schaeuble K et al. Perivascular fibroblasts of the developing spleen act as LTα1β2-dependent precursors of both T and B zone organizer cells. Cell Rep. 21, 2500–2514 (2017). [DOI] [PubMed] [Google Scholar]
- 72.Bar-Ephraïm YE & Mebius RE Innate lymphoid cells in secondary lymphoid organs. Immunol. Rev 271, 185–199 (2016). [DOI] [PubMed] [Google Scholar]
- 73.Magen A et al. Intratumoral dendritic cell-CD4+ T helper cell niches enable CD8+ T cell differentiation following PD-1 blockade in hepatocellular carcinoma. Nat. Med 29, 1389–1399 (2023). [DOI] [PMC free article] [PubMed] [Google Scholar]
- 74.Garon EB et al. Pembrolizumab for the treatment of non-smallcell lung cancer. N. Engl. J. Med 372, 2018–2028 (2015). [DOI] [PubMed] [Google Scholar]
- 75.Filbin MR et al. Longitudinal proteomic analysis of severe COVID-19 reveals survival-associated signatures, tissue-specific cell death, and cell–cell interactions. Cell Rep. Med 2, 100287 (2021). [DOI] [PMC free article] [PubMed] [Google Scholar]
- 76.Traag VA, Waltman L & van Eck NJ From Louvain to Leiden: guaranteeing well-connected communities. Sci. Rep 9, 5233 (2019). [DOI] [PMC free article] [PubMed] [Google Scholar]
- 77.Subramanian A et al. Gene set enrichment analysis: a knowledgebased approach for interpreting genome-wide expression profiles. Proc. Natl Acad. Sci. USA 102, 15545–15550 (2005). [DOI] [PMC free article] [PubMed] [Google Scholar]
- 78.Stringer C, Wang T, Michaelos M & Pachitariu M Cellpose: a generalist algorithm for cellular segmentation. Nat. Methods 18, 100–106 (2021). [DOI] [PubMed] [Google Scholar]
- 79.Petukhov V et al. Cell segmentation in imaging-based spatial transcriptomics. Nat. Biotechnol 40, 345–354 (2022). [DOI] [PubMed] [Google Scholar]
- 80.Korsunsky I et al. Cross-tissue, single-cell stromal atlas identifies shared pathological fibroblast phenotypes in four chronic inflammatory diseases. Med. 3, 481–518 (2022). [DOI] [PMC free article] [PubMed] [Google Scholar]
- 81.Melville J uwot: the uniform manifold approximation and projection (UMAP) method for dimensionality reduction. https://github.com/jlmelville/uwot (2020). [Google Scholar]
- 82.Csardi G et al. The igraph software package for complex network research. InterJournal Complex Syst. 1695, 1–9 (2006). [Google Scholar]
- 83.Bates D, Mächler M, Bolker B & Walker S Fitting linear mixed-effects models using lme4. J. Stat. Softw 10.18637/jss.v067.i01 (2015). [DOI] [Google Scholar]
- 84.Gelman A & Su Y-S arm: data analysis using regression and multilevel/hierarchical models. https://CRAN.R-project.org/package=arm (2020). [Google Scholar]
- 85.Korsunsky I et al. Fast, sensitive and accurate integration of single-cell data with Harmony. Nat. Methods 16, 1289–1296 (2019). [DOI] [PMC free article] [PubMed] [Google Scholar]
- 86.Lee DT & Schachter BJ Two algorithms for constructing a Delaunay triangulation. Int. J. Comput. Inf. Sci 9, 219–242 (1980). [Google Scholar]
- 87.Keren L et al. A structured tumor-immune microenvironment in triple negative breast cancer revealed by multiplexed ion beam imaging. Cell 174, 1373–1387 (2018). [DOI] [PMC free article] [PubMed] [Google Scholar]
Associated Data
This section collects any data citations, data availability statements, or supplementary materials included in this article.
Supplementary Materials
Data Availability Statement
MERFISH data are available at https://singlecell.broadinstitute.org/single_cell/study/SCP2510/human-lung-cancer-harbors-spatially-organized-stem-immunity-hubs-that-associate-with-response-to-immunotherapy#study-summary/. All other data are available in the article and Supplementary Information or from the corresponding authors upon reasonable request.
Code is available at https://github.com/korsunskylab/nsclc_manuscript_2023/.