

SUMMARY
Advances in the synthesis and screening of small-molecule libraries have accelerated the discovery of chemical probes for studying biological processes. Still, only a small fraction of the human proteome has chemical ligands. Here, we describe a platform that marries fragment-based ligand discovery with quantitative chemical proteomics to map thousands of reversible small molecule-protein interactions directly in human cells, many of which can be site-specifically determined. We show that fragment hits can be advanced to furnish selective ligands that affect the activity of proteins heretofore lacking chemical probes. We further combine fragment-based chemical proteomics with phenotypic screening to identify small molecules that promote adipocyte differentiation by engaging the poorly characterized membrane protein PGRMC2. Fragment-based screening in human cells thus provides an extensive proteome-wide map of protein ligandability and facilitates the coordinated discovery of bioactive small molecules and their molecular targets.
Graphical abstract

INTRODUCTION
Chemical probes offer a powerful way to perturb proteins to produce graded (dose-dependent) gain- (agonism) or loss- (antagonism) of-function effects that are acute and reversible in cells and organisms (Weiss et al., 2007). Small molecules that selectively modulate proteins can also serve as leads for the development of novel therapeutics. Most proteins in the human proteome, however, lack chemical probes, and many protein classes are even perceived to be potentially “undruggable” (Hopkins and Groom, 2002).
Chemical probes can be discovered in multiple ways that often involve high-throughput screening (HTS) of individual proteins (target-based) or more complex cell and organismal systems (phenotype based) (Schenone et al., 2013; Swinney and Anthony, 2011). HTS, whether it is target or phenotype based, typically uses large chemical libraries (~106) composed of relatively high-molecular-weight (MW) (300–500 Da) and structurally diverse compounds. Hit compounds from these libraries can prove difficult to optimize due to their size, structural complexity, and suboptimal ligand efficiency (Hajduk and Greer, 2007). Target-based screens are furthermore generally performed with purified proteins and therefore do not provide direct information about the activity of ligands in more complex biological systems (e.g., cells) (Swinney and Anthony, 2011), where factors that regulate protein structure and function, such as subcellular localization, post-translational modification, and protein-protein interactions can affect ligand-protein interactions. Phenotype-based screening, on the other hand, faces the challenge of identifying the molecular target(s) of active compounds, especially in cases where the screening hits display moderate-low potency (Lee and Bogyo, 2013).
Fragment-based ligand and drug discovery (FBLD) has emerged as a versatile approach that addresses some of the challenges noted above. By utilizing smaller numbers (~103) of low-molecular-weight compounds (<300 Da), typically screened at high concentrations (>100 ∝M), FBLD emphasizes the identification of structurally simple hit compounds that can be efficiently optimized into more potent ligands (Hajduk and Greer, 2007; Scott et al., 2012). A core tenet of FBLD is that, by limiting molecular size, a relatively small number of fragments can represent a large fraction of accessible chemical space (Bembenek et al., 2009). For various technical reasons, however, including the general low affinity of fragment hits (>100 ∝M) and the biophysical methods used for their discovery (e.g., NMR, surface plasmon resonance, isothermal calorimetry), FBLD has mainly been limited to in vitro assays with purified proteins (Scott et al., 2012).
We recently described a chemical proteomic analysis of electrophilic fragments that target cysteine residues in hundreds of human proteins in native biological systems (Backus et al., 2016). The covalent interactions of these fragments facilitated target identification, and it has remained an open question whether reversible fragment-protein interactions can be profiled on a similar scale in human cells. This is an important problem because only a subset of the human proteome can be addressed with covalent ligands (e.g., those proteins with nucleophiles in functional sites), and, accordingly, achieving a complete understanding of protein ligandability requires technologies that can globally assess reversible small molecule-protein interactions.
We and others have shown that embedding photoreactive and bioorthogonal reporter groups into bioactive small molecules can facilitate the chemical proteomic analysis of protein targets in cells (Cisar and Cravatt, 2012; Kambe et al., 2014; Niphakis et al., 2015; Sumranjit and Chung, 2013). Here, we hypothesized that this approach could enable proteome-wide FBLD in human cells. Using a set of photoaffinity probes containing fragments common to many drug structures combined with quantitative chemical proteomics, we identify thousands of small molecule-protein interactions in human cells. In follow-up studies, we map the sites of protein binding for many fragments and show that they can be optimized into higher-affinity ligands that affect the function of proteins with good proteome-wide selectivity in cells. Finally, motivated by these findings, we describe the synthesis and phenotypic screening of a larger (~450 member) fragment-based library, leading to the discovery of ligands that promote adipocyte differentiation through targeting the poorly characterized protein PGRMC2.
RESULTS
Profiling Small-Molecule Fragment-Protein Interactions in Human Cells
We synthesized a small library of 14 “fully functionalized” fragment (FFF) probes with each member possessing a variable small-molecule fragment conjugated to a constant tag bearing an alkyne and photoactivatable diazirine group (Li et al., 2013) (Figure 1A). The variable fragment groups had an average molecular weight of 176 Da and were selected because they represent structural motifs found in many biologically active natural products and clinically approved drugs (Figure 1B) (Welsch et al., 2010). We initially assessed the FFF probes using gel-based profiling (Figure S1A) by treating HEK293T cells with each fragment probe (20 ∝M, 30 min), followed by exposure to UV light (10 min, 4°C), cell lysis, coupling to a rhodamine (Rh)-azide tag using copper-catalyzed azide alkyne cycloaddition (CuAAC) chemistry (Rostovtsev et al., 2002), and separation and visualization of fragment-modified proteins by SDS-PAGE coupled with in-gel fluorescence scanning. Despite the structural simplicity and small size of the variable fragment groups, each probe produced marked and differential concentration-dependent protein labeling in HEK293T cells (Figures 1C, S1B, and S1C). Negligible protein labeling was observed in the absence of UV light (Figures 1C and S1B), indicating that the fragment-protein interactions correspond to reversible binding events that were converted to covalent adducts by photoreactivity. Exposure of cells to UV light from 5 to 60 min produced equivalent protein labeling (Figure S1D), while washing cells prior to UV exposure substantially decrease FFF probe labeling for most, but not all proteins (Figure S1E). Finally, a “fragment-less” probe bearing a methyl group (1) produced much less protein labeling, indicating that the variable group of FFF probes is critical for protein binding and suggesting further that 1 could serve as a useful control probe for the chemical proteomic mapping of fragment-protein interactions in cells.
Figure 1. A Chemical Proteomic Strategy for Mapping Fragment-Protein Interactions in Cells.

(A) Schematic depiction of fully functionalized fragment (FFF) probes and experimental workflow to identify FFF-protein interactions in cells by quantitative MS-based proteomics (see STAR Methods for more details).
(B) Structures of FFF probes. Shown in red and blue are the “constant” (containing the diazirine photoreactive group and clickable alkyne handle) and “variable” (consisting of small-molecule fragments; enclosed in box) regions of probes, respectively.
(C) FFF probe-protein interactions in cells. HEK293T cells were treated with probes (20 μM) for 30 min, followed by photocrosslinking and analysis as described in Figure S1A. Red asterisks mark representative distinct probe-protein interactions.
See Figure S1B for additional profiles of FFF probe-protein interactions.
A Global Analysis of Fragment-Protein Interactions in Cells
We next set out to globally map fragment-binding proteins in human cells by quantitative chemical proteomics following the general protocol shown in Figure 1A (Niphakis et al., 2015). We initially compared eleven FFF probes at 200 μM (30 min incubation) to control probe 1 in pairwise experiments using isotopically light and heavy amino-acid-labeled HEK293T cells (and, for a subset of probes, also K562 cells), where proteins strongly enriched by the test FFF probe over 1 (light:heavy ratios >5; Figure S2A) were designated as test probe targets. Under these conditions, FFF probes displayed little to no cytotoxicity (Figure S2B) and interacted with an extensive array of proteins (Table S1). We conducted additional control experiments with representative probes to confirm that targets were enriched in a UV-dependent manner and showed stable isotope labeling with amino acids in cell culture (SILAC) ratios of ~1.0 in experiments where heavy and light cells were treated with equal concentrations of the same FFF probe (Figures S2C and S2D; Table S1).
In aggregate, more than 2000 protein targets were identified for the FFF probes, which individually displayed a broad range of protein enrichments (Figures 2A and S2E; Table S1). When tested at lower concentrations (20 ∝M), FFF probes enriched fewer protein targets (Figures S2E and S2F; Table S1), confirming that the extent of proteome engagement depends on probe concentration. A review of expression-based proteomics data generated in HEK293T cells (Geiger et al., 2012) revealed that the protein targets of FFF probes spanned more than five orders of magnitude in abundance, and this range bracketed the median protein abundance value in HEK293T cells (Figure S2G; Table S1), indicating, along with other analyses (Figures S2H and S2I), that FFF probes enriched proteins across a broad range of expression.
Figure 2. Quantitative MS-Based Proteomic Analysis of Fragment-Protein Interactions in Cells.

(A) Heatmap showing relative protein enrichment values of FFF probes (200 μM) versus control 1 in HEK293T cells.
(B) Representative SILAC ratio plot of proteins differentially enriched in probe-versus-probe (13 versus 3) experiments in HEK293T cells. Proteins preferentially enriched (>3-fold by either probe, depicted with dashed lines) in 13 versus 3 experiments that were also preferentially enriched (>2-fold) by 13 or 3 in probe-versus-control 1 experiments are depicted in red and blue, respectively. Proteins not enriched by either probe are shown in black.
(C) Most proteins demonstrating preferential enrichment (>3-fold) in probe-versus-probe experiments show corresponding preferential enrichment by the same probe in probe-versus-1 experiments. Gray portions of results in (B) and (C) mark proteins that were strongly enriched by both probes in probe-versus-control 1 experiments.
(D–F) Heatmaps (D and E) and extracted MS1 chromatograms of representative tryptic peptides (F) for example proteins preferentially enriched by one FFF probe over control 1 (D) and the corresponding results for these proteins in probe-versus-probe experiments (E).
(G) The majority of proteins that are strongly enriched (SILAC ratio >10) by most FFF probes (eight or more of 11) in probe-versus-control 1 experiments show preferential enrichment by one FFF probe in probe-versus-probe experiments.
(H–J) Heatmaps (H and I) and extracted MS1 chromatograms of representative tryptic peptides (J) for example proteins enriched by many FFF probes over control 1 (H) and preferentially enriched by FFF probe 3 in probe-versus-probe experiments (I).
To more quantitatively assess the structure-activity relationships (SARs) emerging from our initial FFF probe experiments, we performed additional studies comparing the relative protein interaction profiles of FFF probes, wherein isotopically light and heavy cells were treated with two different probes (probe-versus-probe comparisons) and processed as shown in Figure 1A. These experiments revealed that proteins preferentially enriched by one FFF probe relative to another in probe-versus-probe comparisons were also often preferentially enriched by the same probe in original comparisons to control 1 (Figures 2B–2F). The probe-versus-probe comparisons also revealed that most of the proteins showing broad interaction potential across the fragment library in probe-versus-control 1 experiments (gray sub-bars, Figure 2C) still exhibited preferential interactions with one or a subset of FFF probes (Figures 2G–2J).
We verified the fragment interactions profiles for representative proteins by recombinant expression in HEK293T cells. We found that the fragment interaction profile for each recombinant protein, as measured by gel-based profiling (Figure S1A), matched that of its endogenous form as determined by quantitative mass spectrometry (MS)-based proteomics, with each target showing a strong preference for a distinct fragment probe (Figures S2J and S2K).
Types of Proteins and Protein Sites Targeted by Fragments
The fragment probes targeted both membrane and soluble proteins (Figure S3A), and only a small fraction (17%) of these proteins had known ligands as estimated by their presence in the DrugBank database (Figure 3A). This subset of previously liganded proteins was mainly enzymes (Figure 3B). In contrast, the much larger subset of fragment probe targets (83%) not represented in DrugBank showed a broader functional distribution, with a reduced fractional representation of enzymes counterbalanced by expanded coverage of channels/transporters/receptors, transcription factors/regulators, and uncategorized proteins (Figure 3B). A greater percentage of targets enriched by low (20 μM, 24%) versus high (200 μM, 12%) concentrations of fragments were found in DrugBank (Figure 3A), indicating that the capacity to screen higher concentrations of fragment probes expanded the scope of newly discovered ligandable proteins in human cells.
Figure 3. Types of Proteins and Protein Sites Targeted by FFF Probes.

(A and B) Categorization of FFF probe targets based on presence or absence in DrugBank (A) and protein class distribution (B).
(C) Number of FFF probe-modified peptides per protein target.
(D) Distribution of probe-modified peptides that overlap with residues in predicted binding pockets of proteins as determined by fpocket analysis.
(E–G) Examples of probe labeling sites mapped onto protein structures. Tryptic peptides containing probe-labeled sites are shown in green, and residues that overlap with predicted binding pockets are shown in beige. (E) FFF 13-modified peptide (aa 197–215) in human YWHAE (gray, PDB 3UBW) overlaps with the binding cleft that interacts with MLF1 (MLF1-derived peptide shown in yellow). This pocket is also the target of fragment (3S)-pyrrolindin-3-ol (Molzan et al., 2012) shown in purple. (F) FFF 13-modified peptide (aa 66–79) in human BAX (gray, PDB 4ZIE) complexed with BH3 peptide of BIM (cyan). (G) Ribbon structure of human CTSB (gray, PDB 1GMY) highlighting FFF 9-modified peptide (aa 315–332) that is competed by the CTSB inhibitor Z-FA-FMK. Yellow marks the catalytic cysteine C108 (red) bound to Z-FA-FMK.
We next aimed to identify the fragment binding sites on proteins, which was facilitated by isotopically labeling small-molecule probe-modified peptides (Backus et al., 2016; Niphakis et al., 2015). Over 800 unique peptides modified by one or more FFF probes were identified on 443 proteins (Figure S3B; Table S2) in HEK293T cells. Fragment-modified peptides were found in both membrane and soluble proteins (Figure S3B), and, while many proteins were targeted by multiple FFF probes at the same site (Figure S3C), in the substantial majority of cases, only a single fragment-modified peptide was identified per protein (Figure 3C).
Using the pocket-detection algorithm fpocket (Le Guilloux et al., 2009), we found that, for the 186 proteins harboring fragment-modified peptides for which crystal structures were also available (Figure S3B), the vast majority of fragment-modified peptides (~80%) overlapped directly and substantially with predicted ligand-binding pocket residues (Figures 3D and S3D; Table S2). For proteins possessing multiple distinct fragment-modified peptides, we found that these peptides often mapped to a shared predicted pocket (Figure S3E). For proteins with annotated functional residues (e.g., active site residues; 77 total proteins), approximately 60% of the probe-modified peptides were within 6 Å of a functional residue (Figure S3F).
Many of the proteins with mapped fragment-binding sites and crystal structures corresponded to enzymes (Figure S3G), but non-enzymes of note included (1) the 14-3-3 adaptor protein YWHAE, which was modified by probe 13 on a peptide (aa 197–215) that lines the primary interaction cleft for binding the oncoprotein myeloid leukemia factor 1 (MLF1) (Figure 3E) (Yang et al., 2006) (Molzan et al., 2012); and (2) the proapoptotic effector protein BAX, which was also modified by probe 13 on a peptide (aa 66–79) within a groove that binds the BH3-domain containing activators Bim and Bid (Robin et al., 2015) (Figure 3F). Among the enzymes with mapped fragment-binding sites, the cysteine protease cathepsin B (CTSB) was targeted by probe 9 at an active-site proximal peptide (aa 315–332), and this interaction was blocked by the CTSB inhibitor Z-FA-FMK (Figure 3G). We also identified fragment-modified peptides at allosteric or secondary ligand-binding sites, including, for instance, a pocket on α-galactosidase (GLA) proposed to constitute a site for pharmacological chaperoning (Guce et al., 2011) (Figure S3H). Last, we found little overlap (<15%) between FFF targets and proteins liganded by cysteine-reactive electrophilic fragments in a previous study (Figure S3I) (Backus et al., 2016). Even if we restricted this analysis to proteins that contained IA-reactive cysteines in the previous study, the overlap between FFF targets and electrophilic fragments targets remained modest (~28%) (Figure S3I). These results indicate that reversible and irreversible fragments interact with largely distinct subsets of the human proteome.
Functional Characterization of Fragment-Protein Interactions
FBLD typically identifies low-affinity (high μM to mM) hit compounds that often require substantial, structure-guided medicinal chemistry optimization to improve potency and selectivity (Scott et al., 2012). As an alternative and complementary approach to structure-based ligand development, we wondered whether proteome-wide, cell-based fragment screens could be adapted to identify higher-potency ligand-protein interactions. We envisioned accomplishing this goal by screening focused libraries of small molecules containing representative fragment cores elaborated with additional “binding” substituents for competitive blockade of FFF probe-protein interactions in cells (Figure 4A). We purchased or synthesized elaborated competitor molecules for three FFF probes—3, 6, and 8 (Figures 4B and S4A–S4C)—and treated cells with these competitors (17 total, each screened versus DMSO as a control) in 8-fold excess over the corresponding FFF probe (160 μM competitor, 20 μM FFF probe), after which FFF-modified proteins enriched and identified as shown in Figure 4A. A total of 100 competed targets—defined as proteins that displayed substantial reductions (>3-fold) in signal in small-molecule competitor (heavy) versus DMSO (light)-treated cells—were identified (Figures 4C–4F and S4D; Table S3). Competed proteins showed widely varied SARs that ranged from broad interactions with several (>5) competitors to preferential binding to a single competitor (Figure 4D).
Figure 4. Competitive Profiling with Elaborated Fragment-Based Compounds.
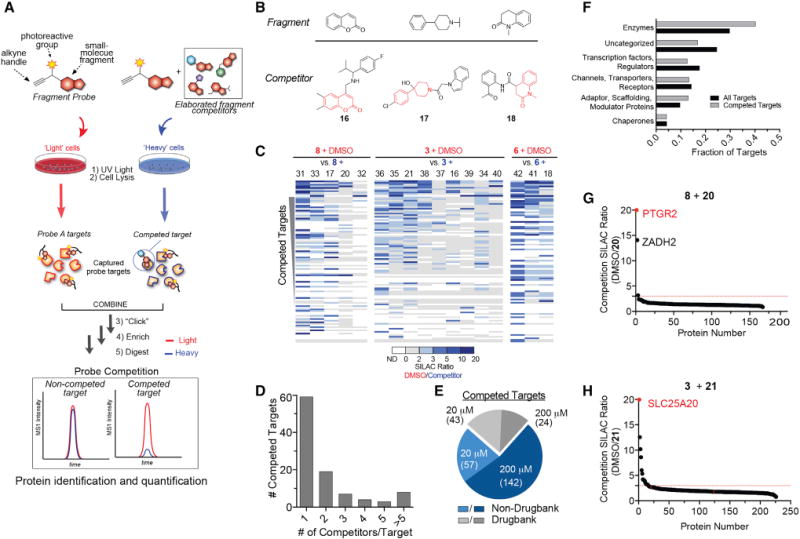
(A) Schematic for competitive profiling experiments (see STAR Methods for more details).
(B) Structure of fragment cores (upper) with representative elaborated competitors (lower, where core fragments are depicted in red).
(C and D) Heatmap of (C) and number of competitor compounds per (D) competed protein targets in experiments using 20 μM FFF and 160 μM competitor.
(E) Categorization of competed targets based on presence or absence in DrugBank for experiments using either 20 or 200 μM FFF probes (+FFF probes (with 8× an 1× competitors, respectively). Targets competed in both 20 and 200 μM datasets were excluded from the 200 μM groups for the pie chart analysis.
(F) Protein functional class distribution for competed targets compared to all FFF probe targets.
(G and H) Representative SILAC ratio plots for competitive profiling experiments with FFF probes 8 (G) and 3 (H) (20 μM) and 8× competitors 20 and 21, respectively. Red lines mark a 3-fold ratio change threshold for designating competed targets.
Another 215 competed targets were mapped in experiments where a subset of the competitors (five total) was tested against higher concentrations of the corresponding FFF probes (200 μM) (Figure S4E). We also noted a greater representation of DrugBank proteins for competed targets identified with low (20 μM) versus high (200 μM) concentrations of FFF probes (43% and 20%, respectively) (Figure 4E; Table S3). These results indicate that performing small-molecule competition studies with higher concentrations of FFF probes, where a much greater proportion of probe targets are enriched and quantified (Figure S2E), increases not only the total number of identified competed protein targets, but also the fraction of these targets that represent heretofore unliganded proteins. Finally, the competed protein targets showed a broad functional class distribution generally matching that found for the greater collection of FFF targets (Figure 4F), suggesting that high-occupancy small-molecule interactions were not biased toward a specific category of protein in human cells.
We next asked whether the discovered small-molecule ligands affected protein function. For this purpose, we selected one enzyme (PTGR2) and one transporter (SLC25A20) for which distinct high-occupancy ligands were identified in competitor profiling experiments (Figures 4G and 4H). These proteins were also chosen because they have important roles in human metabolism but lack selective, cell-active inhibitors. Gel-based competitor profiling of recombinant PTGR2 and SLC25A20 (Figure S5A) confirmed the preferential binding of ligands determined by MS-based proteomics (20 for PTGR2 and 21 for SLC25A20; see Figures 4G and 4H). In contrast, competitor molecules containing only the fragment head groups of FFF probes did not appreciably block probe labeling of PTGR2 and SLC25A20 (Figure S5B). These results indicate that chemical proteomics can discover weak fragment-protein interactions in cells and, through competitive profiling of structurally elaborated fragment analogs, efficiently identify compounds that display superior protein binding.
PTGR2, or prostaglandin reductase 2, catalyzes the NADPH-dependent reduction of 15-keto-PGE2, an endogenous ligand for the nuclear receptor PPARγ (Chou et al., 2007). The only reported inhibitor of PTGR2 is the nonsteroidal anti-inflammatory drug (NSAID) indomethacin, which exhibits a very weak in vitro IC50 value of ~200 μM (Wu et al., 2008). Probe 8 modified two active site-proximal peptides in PTGR2, and these reactions were sensitive to competition by 20 (Figure 5A), which also inhibited PTGR2-mediated reduction of 15-keto-PGE2 with an IC50 value of 79 μM (Figure 5B). A screen of structural analogs of 20 identified compound 22 (Figures 5C and S5C), which showed substantially increased potency (>20-fold) in assays measuring either competition of 8-labeling (Figure 5C) or 15-keto-PGE2 reductase activity (IC50 = 0.6 μM; Figure 5B) of recombinant PTGR2, as well as an inactive control compound 23 (Figures 5B, 5C, and S5C).
Figure 5. Fragment-Derived Ligands Disrupt Function of PTGR2 and SLC25A20 in Human Cells.

(A) Structure of PTGR2 (PDB 2ZB4, gray) highlighting FFF 8-modified tryptic peptides (aa 55–66, green; and aa 261–278, pink) competed by 20 (MS1 plot insets). 15-keto-PGE2 in yellow; NADP+ in blue.
(B) PTGR2 ligands 22 (blue) and 20 (red) but not inactive control 23 (black), inhibited 15-keto-PGE2 reductase activity of recombinant PTGR2. Data represent average values ± SD; n = 3 per group.
(C) Structures (top) of initial PTGR2 ligand 20, optimized ligand 22, and inactive analog 23 and gels (bottom) showing concentration-dependent competitor blockade of FFF 8 labeling of recombinant PTGR2 in HEK29T cells.
(D) Compound 22, but not inactive control 23, increased 15-keto-PGE2-dependent PPARγ transcriptional activity in PTGR2-transfected HEK293T cells. Data represent average values ± SD; ####p < 0.0001 for 15k-PGE2-treated PTGR2-transfected cells (blue bars) versus empty vector group (gray bar), ****p < 0.0001 for compound- versus DMSO-treated groups; n = 3 per group.
(E) Structures (top) and activities (bottom gels) of SLC25A20 ligand 21 and inactive analog 24. Gel (bottom) showing concentration-dependent competitor blockade of FFF 3 labeling (20 μM) of recombinant SLC25A20 in HEK29T cells.
(F and G) Compound 21, but not 24, increases long-chain (>C14) acylcarnitine content (F) and reduces maximal exogenous fatty acid oxidation (G) of HSC-5 cells. Data represent average values ± SD; **p < 0.01 and ****p < 0.0001 for compound- versus DMSO-treated groups; n = 3–5 per group.
Compound 22, but not 23, blocked FFF 8 labeling of endogenous PTGR2 in HEK293T cells with good potency (complete inhibition at 5 μM and ~80% inhibition at 500 nM) and excellent selectivity (Figures S5D–S5F). Of note, 22 did not cross-react with ZADH2 (Figure S5E), a sequence-related homolog of PTGR2 that was a principal off target of 20 (Figure 4G). Compound 22, but not 23, also produced a concentration-dependent rescue of 15-keto-PGE2-dependent PPARγ transcriptional activity in cells recombinantly expressing PTGR2 (Chou et al., 2007) (Figure 5D). We confirmed that neither 22 nor 23 directly modulated PPARγ (Figure S5G). The IC50 value displayed by 22 for inhibition of PTGR2 in cells was ~0.7 μM (Figure S5H), which meets the criterion for in situ activity of chemical probes put forth by the Structural Genomics Consortium (Edwards et al., 2009).
SLC25A20 is a multi-pass transmembrane protein that transports long-chain acylcarnitines into the mitochondrial matrix, where these lipids provide fatty acid substrates for β-oxidation (Indiveri et al., 2011). There are, to our knowledge, no selective small-molecule probes to study SLC25A20 function in human cells. Our quantitative MS experiments identified SLC25A20 as a primary target of the elaborated coumarin-based competitor 21 (Figure 4H), and we confirmed this interaction for recombinant SLC25A20 in HEK293T cells, where 21 blocked FFF probe 3 labeling of SLC25A20 with an apparent IC50 of ~10 μM (Figure 5E). We also identified the coumarin-based compound 24 as an inactive control (Figures 5E, S5I, and S5J). We were not able to identify a site of probe binding on SLC25A20, possibly reflecting the recognized challenges with mapping hydrophobic peptides on transmembrane proteins by MS (Tan et al., 2008).
Compound 21 (0.2–100 μM, 3 hr), but not the inactive control 24 (100 μM), produced a strong, concentration-dependent increase in long-chain (C16, C18, C18:1) acylcarnitines in human squamous cell carcinoma (HSC5) cells, with significant effects being observed for 21 at concentrations (20–50 μM; Figure 5F), where 21 also substantially blocked probe 3 labeling of SLC25A20 in cells as measured by quantitative MS-based proteomics (Figures S5J and S5K). No changes were found in short-or medium-chain acylcarnitines (<C16), which are thought to cross the mitochondrial membranes without conversion to acylcarnitine esters (Violante et al., 2013). We also found that HSC5 cells treated with 21, but not 24, showed impaired capacity to oxidize palmitate (Figures 5G and S5L). These data, taken together, show that 21 acts as a selective, cell-active inhibitor of SLC25A20, leading to disruption of mitochondrial long-chain acylcarnitine transport and fatty acid oxidation (FAO).
Phenotypic Screening with Fragment-Based Probes
We noted that the average MW of the elaborated competitors was ~340 Da, which suggested that only modest increases in size and structural diversity of the FFF cores could furnish probes capable of high stoichiometric engagement of diverse proteins in cells. We therefore hypothesized that a larger library of slightly elaborated FFF probes could prove useful for phenotypic screening, where the inclusion of photoreactive and clickable groups would facilitate direct enrichment and identification of protein targets from cells exhibiting a specified biological response. We accordingly generated an expanded, second-generation library of FFF probes with 465 members (Table S4), where the median MW of the variable recognition element was 267 Da. For the vast majority (~90%) of the library, we also synthesized paired competitor molecules, where the constant photoreactive/clickable component was replaced with a propanamide group, to assist in the assignment of high-occupancy targets of bioactive probes (Figure S6A).
We next assayed a subset of the FFF library (~300 members; 50 μM each) for effects on adipogenesis, an important, but incompletely understood cell biological process of both basic and translational research interest. We specifically screened for compounds that promote the differentiation of 3T3-L1 mouse preadipocytes to adipocytes as assessed by lipid accumulation measured with the fluorescent dye Nile Red (Dominguez et al., 2014; Waki et al., 2007). Nine FFF probes were identified that promoted substantial (>3-fold) lipid accumulation compared to control assays with DMSO (Figures S6B and S6C). The FFF hits were not direct agonists of PPARγ (Figure S6D), indicating that they operated by a distinct mechanism from the positive control agent rosiglitazone (Figure S6B). From these hits, we selected the b-naphthyl leucine probe 25 for further investigation because this compound promoted one of the highest levels of lipid accumulation (Figures 6A, 6B, and S6B) and induced key adipogenic markers (e.g., PPARγ, FABP4, CD36) in differentiating 3T3-L1s, human mesenchymal stem cells (hMSCs), 10T1/2 cells, and primary brown preadipocytes at concentrations as low as 10 μM (Figures 6C and S6E). In contrast, probe 25 did not induce lipid accumulation in non-adipocyte cell lines (Figure S6F). We also identified a structurally similar control probe 26 (Figure 6B) that displayed much less adipogenic activity (Figures 6A, 6D, and S6B), and confirmed that the corresponding competitor agents for both 25 (propanamide 27) and 26 (propanamide 28) were active and largely inactive in adipogenesis-related assays, respectively (Figures 6A, 6B, and 6D). Two additional structurally related competitor agents (29 and 30) were also identified as inactive controls (Figures 6A, 6B, and 6D).
Figure 6. Phenotypic Screening Identifies FFF Probes with Pro-Adipogenic Activity.

(A) FFF probe 25 and competitor 27, but not inactive controls 26 and 28–30, promote 3T3-L1 preadipocyte differentiation. Cells were induced to differentiate into adipocytes 2 days post-confluence in the presence of vehicle (DMSO), compounds (10 μM), or the positive control rosiglitazone (2 μM), and lipid accumulation and adipocyte differentiation were evaluated on day 8 using the fluorescent dye Nile red (red). Hoechst (blue) was used to stain nuclei. Scale bar, 100 μm.
(B) Structures of active (25) and inactive (26) probes and corresponding competitors (27 and 28–30, respectively).
(C and D) Compounds 25 (C and D) and 27 (D), but not 26 or 28–30 (D), induce adipocyte differentiation-related gene expression in 3T3-L1 cells and additional preadipocyte cells (evaluated for 25) and hMSCs (human mesenchymal stem cells).
(E) The pro-adipogenic activity of 25 (10 μM) was observed in 3T3-L1 preadipocytes if added on days 0–8 or 2–8, but not on days 4–8 of differentiation. For (C)–(E), data represent average values ± SD; *p < 0.05, **p < 0.01, ***p < 0.001 for compound- versus DMSO-treated groups; n = 3 per group.
Time-course studies determined that 25 acted early (within the first 2 days of the 8-day treatment) to induce adipocyte differentiation (Figure 6E), and we therefore surmised that relevant protein targets should be expressed in 3T3-L1 preadipocyte cells. Two types of quantitative proteomic experiments were used to identify targets of 25 in 3T3-L1 cells: (1) preferential enrichment experiments, where isotopically light cells were treated with 25 (10 μM, 30 min) and compared to isotopically heavy cells treated with 26 (10 μM); and (2) competition experiments, where both heavy and light cells were treated with 25 (10 μM), and heavy cells also incubated with 10× active (27) or inactive (28–30) competitors. We considered proteins preferentially enriched by 25 over 26 (>3-fold) and competed by 27 (>3-fold), but not 28–30, as targets with a good probability of contributing to the pro-adipogenic properties of 25. Only a single protein—PGRMC2—was found to satisfy these criteria (Figures 7A and S7A–S7C; Table S5).
Figure 7. PGRMC2 as a Target of Pro-Adipogenic Compound 25.

(A) Plot comparing SILAC ratios for protein targets of 25 in 3T3-L1 cells. y axis shows SILAC ratios for proteins enriched from cells treated with active (25) or inactive (26) FFF probes (10 μM). × axis shows SILAC ratios for proteins competed in cells treated with active FFF probe 25 (10 μM) and DMSO or the active competitor 27 (100 μM). Dotted lines indicate threshold for proteins to be designated as preferentially enriched by 25 (horizontal line) or competed by 27 (vertical line). Proteins highlighted in blue and red represent targets that were competed or not competed, respectively, by inactive control compounds 28–30 (see Figure S7A). Ratios are presented as median values derived from three independent biological experiments.
(B) MS1 chromatograms for representative tryptic peptides from PGRMC2 in the designated experiments.
(C) UV-dependent labeling of recombinant human PGRMC2 expressed in HEK293T cells by FFF probe 25 was blocked by 27, but not 28. PGRMC2 was not substantially labeled by inactive FFF probe 26.
(D) The 25-modified tryptic peptide (aa 167–184) in human PGRMC2 is part of the cytochrome-b5-like/steroid binding domain.
(E) PGRMC2 is required for the pro-adipogenic effect of 25. Mouse 3T3-L1 preadipocytes infected with lentiviruses expressing shRNA against mouse PGRMC2 were induced to differentiate in presence of vehicle, 25 (10 μM), or rosiglitazone (2 μM). Expression of an shRNA-resistant human PGRMC2 in mPGRMC2-depleted cells restored the pro-adipogenic effect of 25 in 3T3-L1 cells.
(F) Expression of adipocyte markers in GFP- and hPGRMC2-overexpressing 3T3-L1 preadipocytes induced to differentiate for 8 days.
(G and H) Heatmap showing top pathways altered in differentiating PGRMC2- versus GFP-expressing 3T3-L1 preadipocytes induced to differentiate for 1 day (G) and NR1D1 expression in these cells (H) (also see Table S6).
(I and J) The NR1D1 antagonist SR8278 (10 μM), but not the NR1D1 agonist GSK4112 (10 μM) blocks the pro-adipogenic effect of 25 (10 μM) as measured by Nile Red staining (J) or adipogenic gene expression (I).
For (F), (H), and (I), data represent average values ± SD, n = 3 per group.; for (F), *p < 0.05 for PGRMC2 versus GFP; for (H) and (I), ***p < 0.001 for compound-versus DMSO-treated groups, ###p < 0.001 for compound-versus-control groups.
PGRMC2, or progesterone receptor membrane component 2, is a poorly characterized transmembrane protein with a predicted cytoplasmic cytochrome b5 domain (Gerdes et al., 1998; Wendler and Wehling, 2013). PGRMC2 shares sequence homology (49%) with another transmembrane protein PGRMC1, which was not preferentially enriched by 25 over 26 or competed by 27 (Figure 7A). Despite the names of these proteins, their biologically relevant ligands (progesterone or other) and functions remain largely unknown (Cahill, 2007). We confirmed that recombinant human PGRMC2 expressed in HEK293T cells was strongly labeled by 25, but not 26, and this labeling was blocked in a concentration-dependent manner by active competitor 27, but not inactive competitor 28 (Figure 7C). We determined by isoTOP-ABPP that 25 modifies the tryptic peptide aa 167–184 of PGRMC2 (Figure 7D), which maps to the predicted cytochrome b5 (ligand-binding) domain (Mifsud and Bateman, 2002).
Having confirmed a specific interaction between 25 and PGRMC2, we next used lentiviral-mediated delivery of two distinct short hairpin RNAs (shRNAs) to deplete PGRMC2 from 3T3-L1 cells. Neither shRNA, despite achieving substantial knockdown of PGRMC2 (Figures S7D and S7E), induced lipid accumulation in 3T3-L1 cells (Figures 7E and S7E). Instead, the shRNA-mediated reductions in PGRMC2 expression blocked the pro-adipogenic activity of 25, as evidenced by measurements of lipid accumulation (Figure 7E) and PPARG, FABP4, and CD36 expression (Figure S7D). Expression of an shRNA-resistant human PGRMC2 protein in 3T3-L1 cells depleted of endogenous mouse PGRMC2 (Figures S7D and S7E) fully restored the pro-adipogenic effects of 25 (Figures 7E and S7D). These data, taken together, suggest that 25 acts as a gain-of-function ligand for PGRMC2 to promote adipogenesis.
We found that stable overexpression of PGRMC2 enhanced expression of adipogenic markers in differentiating 3T3-L1 cells (Figures 7F and S7F), and that PGRMC2 was primarily localized to the nuclear envelope (Figure S7G), suggesting that the protein may participate in a biochemical pathway that regulates pro-adipogenic gene expression. Transcriptome analysis performed by RNA sequencing (RNA-seq) 24 hr after induction of adipocyte differentiation identified changes in several functional pathways, including adipogenesis, in PGRMC2-expressing 3T3-L1 cells compared to control GFP-expressing cells (Figure 7G; Table S6). Ingenuity pathway analysis (IPA) of putative direct transcriptional regulators that were elevated in PGRMC2-overexpressing cells and are known to be involved in adipogenesis, identified the nuclear receptor Rev-erbα (NR1D1) (Wang and Lazar, 2008) (Figure 7H) as a candidate transcriptional mediator of the pro-adipogenic effects of PGRMC2. Consistent with this hypothesis, the pro-adipogenic effects of 25 were blocked when cells where co-treated with the NR1D1 antagonist SR8278 (Kojetin et al., 2011), while the NR1D1 agonist GSK4112 (Grant et al., 2010) had no effect (Figures 7I and 7J).
Heme is an endogenous ligand for NR1D1 (Raghuram et al., 2007; Yin et al., 2007) and, along with iron, promotes adipocyte differentiation (Chen and London, 1981; Moreno-Navarrete et al., 2014). Considering further that PGRMC1 has recently been shown to bind heme and proposed to function as a mitochondrial heme sensor (Kabe et al., 2016; Piel et al., 2016), we examined whether PGRMC2 also interacts with heme-related molecules and found that both hemin and the hemin precursor protoporphyrn IX bound PGRMC2 with IC50 values of 40 and 0.13 μM as determined by competitive displacement assays with probe 25 (Figure S7H). These findings, taken together suggest that PGRMC2 may promote adipogenesis by sensing and/or facilitating the nuclear transport of heme-related molecules for activation of NR1D1. In this model, 25 may mimic the activity or promote the nuclear transport of heme-related molecules.
DISCUSSION
We have described herein a chemical proteomic method to globally map small-molecule fragment-protein interactions directly in human cells. More than 2,000 fragment-binding proteins were discovered, only a small fraction of which was found in DrugBank, highlighting the broad and still largely untapped ligandability of the human proteome. We demonstrated that the discovered fragment-protein interactions can be further advanced to generate selective ligands that modulate the functions of proteins in cells. That the case studies investigated herein include enzymes (PTGR2), transporters (SLC25A20), and poorly characterized transmembrane proteins (PGRMC2) for which selective ligands were previously lacking, underscores the versatility and scope of chemical proteomics for accelerating the discovery of small-molecule probes for diverse categories of proteins.
Our results also provide a useful perspective on the principles of FBLD applied proteome-wide. As anticipated, the fragment-protein interactions discovered in cells appear to be of generally low affinity, as evidenced by the large increase in protein enrichments with higher concentrations of FFF probes (200 versus 20 μM). Still, clear evidence of SARs was found for most fragment-protein interactions, indicating that they reflect authentic recognition events at discrete sites on proteins. This conclusion is also supported by our chemical proteomic data on mapping sites of fragment-binding, which revealed a high overlap (~80%) with computationally predicted pockets on protein structures. These results, taken together, support and extend the generality of concepts about ligandability that have emerged from FBLD studies of individual proteins (Edfeldt et al., 2011; Kozakov et al., 2015; Wells and McClendon, 2007), including the presence of discrete hotspots on protein surfaces, both active site and other (e.g., allosteric), poised for small-molecule binding and the capacity for simple fragments to interrogate these pockets even in the complex environment of the living cell.
Our studies also provide compelling evidence that FFF probes can streamline the discovery of targets of bioactive small molecules in phenotypic screens. We attribute this success to the incorporation of photoreactive and clickable elements into the screening library itself, which circumvents the need to further derivatize hits prior to initiating target identification. We also emphasize the importance of utilizing inactive control probes and competitors to hone in on targets of pharmacological relevance to the observed phenotype. The discovery of apparent gain-of-function ligands for PGRMC2 that promote adipogenesis, combined with the independent proadipogenic activity displayed by PGRMC2 when overexpressed in preadipocytes, designates this poorly characterized membrane protein as a potentially important regulator of adipocyte differentiation and function. It is tempting to speculate that the chemical probes discovered herein may mimic the action of metabolites that serve as endogenous ligands for PGRMC2, and our initial studies point to heme-related molecules as potential candidates to serve this function. FFF probes like 25 should facilitate the discovery and further characterization of such endogenous ligands by forming the basis for competitive displacement assays, as we have demonstrated for PGRMC2 interactions with heme-related molecules (Figure S7H) and could be extended to more broadly survey small-molecule extracts of cells/tissues (Kim et al., 2011).
Projecting forward, we believe that chemical proteomic methods for fragment-based ligand discovery have the potential to fill major gaps in small-molecule probe development by enabling the discovery of reversible ligands, and the sites of ligand binding, for many proteins in parallel directly in human cells. In this manner, the FFF platform described herein complements and augments recently described approaches to discover covalent, cysteine-reactive ligands (Backus et al., 2016) and ligands targeting lipid-binding proteins in proteomes (Niphakis et al., 2015), as well as biophysical methods, such as thermal shift assays, to measure drug-protein engagement in cells (Martinez Molina et al., 2013; Savitski et al., 2014). There are also some technical limitations of the FFF platform. As expected for structurally simple fragments, the FFF probes are promiscuous in their proteomic interactions, which may limit the detection of lower abundance proteins in cells. The use of targeted or semi-targeted proteomic methods should increase dynamic range and sensitivity (Picotti and Aebersold, 2012). Also, while we have shown that competitive profiling of structurally elaborated fragment-based libraries can facilitate the advancement of hit fragments into more potent and selective cell-active probes, it is likely that such chemical proteomic approaches will need to be combined with more structure-guided methods to create a general strategy for ligand optimization (Kolb et al., 2009; Sliwoski et al., 2013). This integrated approach may be especially important for advancing the many fragment hits discovered herein for proteins that belong to classes historically viewed as “undruggable,” such as transcription factors and adaptor proteins.
Finally, we also believe that chemical proteomic methods for ligand discovery and optimization should benefit from recent advances in synthetic methodology, which have described many reactions for the late-stage chemical derivatization of small molecules (Brückl et al., 2012; Dai et al., 2011). One could even envision creating an FFF library where sites for end-stage derivatization are built into the probes such that fragments with provocative target profiles are efficiently converted into diversified sub-libraries that are then rescreened in human cells to optimize many ligand-target pairs in parallel. In this way, the full ligandability of the human proteome can be empirically defined and efficiently exploited to furnish chemical probes for investigations of human biology.
STAR★METHODS
Detailed methods are provided in the online version of this paper and include the following:
KEY RESOURCES TABLE
| REAGENT or RESOURCE | SOURCE | IDENTIFIER |
|---|---|---|
| Antibodies | ||
| PGRMC2 | Bethyl Laboratories | A302-955A; RRID: AB_10691116 |
| V5 Epitope | Life Technologies | R960-25; RRID: AB_2556564 |
| β-Actin | Cell Signaling Tech | 4970; RRID: AB_2223172 |
| KDEL monoclonal antibody (10C3) | Enzo Life Sciences | ADI-SPA-827; RRID: AB_10618036 |
| IRDye 800CW anti-mouse | LICOR | 925-32210 |
| IRDye 800CW anti-rabbit | LICOR | 925-32211 |
| Anti-FLAG | Sigma-Aldrich | F1804; RRID: AB_262044 |
| GAPDH | Millipore | MAB374; RRID: AB_2107445 |
| Alexafluor-488 anti-rabbit | Thermo Fisher | A-11008; RRID: AB_143165 |
| Alexafluor-568 anti-mouse | Thermo Fisher | A-11004; RRID: AB_2534072 |
| Chemicals, Peptides, and Recombinant Proteins | ||
| Insulin | Sigma-Aldrich | I6634 |
| Dexamethasone | Sigma-Aldrich | D1756 |
| 3-Isobutyl-1-methylxanthine | Sigma-Aldrich | I7018 |
| Rosiglitazone | Cayman Chemical | 71749 |
| SR8278 | TOCRIS | 4463 |
| GSK4112 | CALBIOCHEM | 554716 |
| 3,3′,5-Triiodo-L-thyronine sodium salt | Sigma-Aldrich | T5516 |
| Polyethylenimine HCl MAX, Linear, Mw 40,000 | Polysciences | 24765 |
| 15-keto Prostaglandin E2 | Cayman Chemical | 14720 |
| Oligomycin A | Sigma-Aldrich | 75351 |
| Carbonyl cyanide 4-(trifluoromethoxy) phenylhydrazone | Sigma-Aldrich | C2920 |
| Rotenone | Sigma-Aldrich | R8875 |
| Antimycin A | Sigma-Aldrich | A8674 |
| Palmitic acid | Sigma-Aldrich | P0500 |
| Bovine Serum Albumin, FA-free | Sigma-Aldrich | A7511 |
| DMSO | Sigma-Aldrich | D8418 |
| Blasticidin | Fisher Scientific | 50712728 |
| [13C6, 15N2]- L-lysine; [13C6, 15N4]-L-arginine | Sigma-Aldrich | 608041; 608033 |
| Tris(benzyltriazolylmethyl)amine (TBTA) | Cayman Chemical | 18816 |
| Tris(2-carboxyethyl)phosphine HCl (TCEP) | Sigma-Aldrich | 75259 |
| Tetramethylrhodamine (TAMRA) azide | Synthesized in-house | N/A |
| Biotin-PEG4-azide | ChemPep | 271606 |
| Streptavidin agarose resin | Pierce | 20347 |
| Sequencing grade modified trypsin | Promega | V5111 |
| Biotin-TEV-azide | Weerapana et al., 2007 | N/A |
| Prostaglandin E2-d4 | Cayman Chemical | 314010 |
| 13,14-Dihydro-15-keto-PGE2 | Cayman Chemical | 10010606 |
| Acyl carnitine internal standard mix | Cambridge Isotope Laboratories | NSK-B-1 |
| Human recombinant PTGR2 | Fitzgerald | 80R-2246 |
| NADPH tetrasodium salt | EMD Millipore | 481973 |
| See Chemistry Procedures for synthesis of additional compounds | This Paper | N/A |
| Critical Commercial Assays | ||
| SSIII 1-STEP QRT-PCR 500 500 RXN | Life Technologies | 11732088 |
| AdipoRed Adipogenesis Assay Reagent | LONZA | PT-7009 |
| Hoechst 33342 | Life Technologies | H1399 |
| Acti-stain 670 phalloidin | Cytoskeleton | PHDN1-A |
| TEV protease | Backus et al., 2016 | N/A |
| Hemin | Fisher Scientific | ICN19882001 |
| Protoporphyrin IX | Frontier Scientific | P562-9-1 |
| Deposited Data | ||
| Raw and analyzed RNaseq data | This paper | GEO: GSE90731 |
| Experimental Models: Cell Lines | ||
| 3T3-L1 | ATCC | CL-173 |
| C3H/10T1/2 | ATCC | CCL-226 |
| Human Mesenchymal Stem Cells | LONZA | PT-2501 |
| HuTu 80 | ATCC | HTB-40 |
| STC-1 | ATCC | CRL-3254 |
| HEK293T | ATCC | CRL-3216 |
| K562 | ATCC | CCL-243 |
| HSC-5 | JCRB Cell Bank | JCRB1016 |
| Recombinant DNA | ||
| p5XGAL4UAS-Luc | Addgene | 33020 |
| pCMV-GAL4 | Addgene | 24345 |
| pCMV-GAL4PPARg | Dominguez et al., 2014 | N/A |
| pLX304hPGRMC2V5 | The ORFeome Collaboration | ccsbBroad304_14045 |
| pLKO.1shPGRMC2 #1 | Sigma-Aldrich | TRCN0000342207 |
| pLKO.1shPGRMC2 #2 | Sigma-Aldrich | TRCN0000342157 |
| pLKO.1scramble | Sigma-Aldrich | SHC002 |
| pCMV6Entry-DDK-SLC25A20 (human) | Origene | RC200234 |
| pRK5-FLAG-ARF1 (human) | This paper | N/A |
| pRK5-FLAG-PTGR2 (human) | This paper | N/A |
| pRK5-FLAG-AIFM1 (human) | This paper | N/A |
| pRK5-FLAG-KPNA2 (human) | This paper | N/A |
| pRK5-FLAG-DCTPP1 (human) | This paper | N/A |
| Sequence-Based Reagents | ||
| Primers and probes sequences provided in Table S7 | ||
| Software and Algorithms | ||
| Ingenuity Pathway Analysis | QIAGEN | http://www.ingenuity.com |
| RStudio | RStudio | https://www.rstudio.com |
| RAW Xtract | version 1.9.9.2; 2004 release | http://fields.scripps.edu/downloads.php |
| Integrated Proteomics Pipeline (IP2) and ProLuCID | Integrated Proteomics Applications, Inc | http://goldfish.scripps.edu/ |
| CIMAGE | Weerapana et al., 2010 | N/A |
| fpocket | Le Guilloux et al., 2009 | http://fpocket.sourceforge.net |
| UCSF Chimera package | UCSF | https://www.cgl.ucsf.edu/chimera/ |
| GraphPad Prism | GraphPad Software Inc | http://www.graphpad.com/scientific-software/prism/ |
| Image Lab (v5.2.1 build 11) | Bio-Rad Laboratories | N/A |
| Custom scripts for data processing | This paper | https://github.com/Chymichead/FBDDinCell |
CONTACT FOR REAGENT AND RESOURCE SHARING
Further information and requests for resources and reagents should be directed to the Lead Contact, Benjamin Cravatt (cravatt@scripps.edu)
EXPERIMENTAL MODEL AND SUBJECT DETAILS
Cell Lines
HEK293T cells were maintained in high-glucose DMEM (GIBCO) supplemented with 10% (v/v) fetal bovine serum (FBS), penicillin (100 U/mL), streptomycin (100 μg/mL) and L-glutamine (2 mM). K562 and HSC-5 cells were maintained in high-glucose IMDM (GIBCO) supplemented with 10% (v/v) fetal bovine serum (FBS), penicillin (100 U/mL) and streptomycin (100 μg/mL). All cell lines were grown at 37°C in a humidified 5% CO2 atmosphere. For SILAC experiments, each cell line was passaged at least six times in either SILAC DMEM or SILAC IMDM, (Thermo), which lack L-lysine and L-arginine, and supplemented with 10% (v/v) dialyzed FBS (Gemini), PSQ (as above), and either [13C6, 15N2]- L-lysine and [13C6, 15N4]-L-arginine (100 μg/mL each) or L-lysine·HCl and L-arginine,HCl (100 μg/mL each). Heavy and light cells were maintained in parallel and cell aliquots were frozen after six passages in SILAC media and stored in liquid N2 until needed. Whenever thawed, cells were passaged at least three times before being used in experiments.
3T3-L1 preadipocytes were maintained in DMEM supplemented with 10% bovine calf serum. 10T1/2 cells were maintained in DMEM with 10% fetal bovine serum (FBS). To induce differentiation, confluent cells were cultured in DMEM with 10% FBS and exposed to dexamethasone (1 μM), 3-isobutyl-1-methylxanthine (IBMX; 0.5 mM), and insulin (1 μg/ml) for 2 days, followed by culture with insulin alone (1 μg/ml). Protocol used for the derivation of primary mouse adipocytes was approved by the TSRI’s IACUC.
METHODS DETAILS
In situ labeling of live cells with FFF probes
For gel-based experiments, cells were grown in 6-well plates to ~90% confluence at the time of treatment. Cells were carefully washed with Dulbecco’s phosphate buffered saline (DPBS) and replenished with fresh serum-free media containing indicated FFF probe, and, if applicable, competitors or DMSO vehicle (1 mL). Following incubation at 37°C for 30 min, cells were directly exposed to 365 nm light for 10 min. For no UV experiments, cells were incubated at 4°C for 10 min under ambient light. For MS-based experiments, cell labeling was performed in a similar manner as described above. Modifications to this protocol included using isotopically ‘light’ and ‘heavy’ SILAC cells that were grown to near complete confluence prior to treatment in 10 cm plates. In probe-versus-control probe and probe-versus-probe experiments, isotopically light cells were treated with indicated fragment probe, while the heavy cells were treated with control probe (1), or additional FFF probe to be compared, at indicated concentrations. In competition type experiments, heavy and light cells were co-treated with the indicated FFF probe and competitor or DMSO, respectively. Following treatments and photocrosslinking, cells were harvested in cold DPBS by scraping, centrifuged (1,400 g, 3 min, 4°C), and pellets washed with cold DPBS (2X) and then aspirated. Pellets were either directly processed or kept frozen at −80°C until use.
Preparation of probe-labeled proteome for gel- and MS-based protein analyses
Cells pellets were lysed in cold DPBS (100–500 μL) using a Branson Sonifier probe sonicator (10 pulses, 30% duty cycle, output setting = 4). For experiments requiring cell fractionation into membrane and soluble proteomes, cell lysates were then centrifuged (100,000 ×g, 45 min) to provide soluble (supernatant) and membrane (pellet) fractions. Membrane pellets were resuspended in cold DPBS after separation by sonication. Protein concentration was determined using the DC Protein Assay (Bio-Rad) and absorbance read using a Tecan, Infinite F500 plate reader following manufacturer’s instructions. For SILAC experiments, isotopically heavy and light whole cell lysates were adjusted to 1.5 mg/mL, and were then mixed in equal proportions (500 μL each) in cold DPBS.
Gel-based analysis of crosslinked proteins in cells
Proteomes from treated cells were diluted to 1 mg/mL. To each sample (50 μL), 6 μL of a freshly prepared “click” reagent mixture containing 0.1 mM tris(benzyltriazolylmethyl)amine (TBTA) (3 μL/sample, 1.7 mM in 1:4 DMSO:t-ButOH), 1 mM CuSO4 (1 μL/sample, 50 mM in H2O), 25 μM tetramethylrhodamine (TAMRA) azide (1 μL/sample, 1.25 mM in DMSO), and freshly prepared 1 mM tris(2-carboxyethyl)phosphine HCl (TCEP) (1 μL/sample, 50 mM in PBS or H2O) was added to conjugate the fluorophore to probe-labeled proteins. Upon addition of the click mixture, each reaction was immediately mixed by vortexing and then allowed to react at ambient temperature for 1 hr before quenching the reactions with SDS loading buffer (4X stock, 17 μL). Proteins (25 μg total protein loaded per gel lane) were resolved using SDS-PAGE (10% acrylamide) and visualized by in-gel fluorescence on a Bio-Rad ChemiDoc MP flatbed fluorescence scanner. Gel fluorescence and imaging was processed using Image Lab (v 5.2.1) software.
Preparation of labeled proteome for MS-based analysis
Profiling experiments were adapted methods previously reported (Niphakis et al., 2015). To the combined mixture of heavy and light soluble proteomes (1.5 mg) in 1 mL DPBS, a mixture of TBTA (60 μL/sample, 1.7 mM in 1:4 DMSO:t-BuOH), CuSO4 (20 μL/sample, 50 mM in H2O), TCEP (20 μL/sample, 50 mM in DPBS) and Biotin-N3 (10 μL/sample, 10 mM in DMSO) was added and each sample was rotated at room temperature. After 1 hr, the mixture was transferred to a 15 mL falcon tube and a cold 4:1 mixture (2.5 mL) of methanol (MeOH)/chloroform (CHCl3) was added followed by cold PBS (1 mL) on ice. The resulting cloudy mixture was centrifuged (5,000 × g, 10 min, 4°C) to fractionate the protein interphase from the organic and aqueous solvent layers. After washing the protein disc carefully with cold 1:1 MeOH:CHCl3 (3 × 1 mL) followed by sonication in cold 4:1 MeOH:CHCl3 (3 mL) to ensure click reagents were efficiently removed, the remaining precipitate was pelleted by centrifugation (5,000 × g, 10 min, 4°C). The pellet was aspirated and resuspended in a freshly-prepared solution of proteomics-grade urea (500 μL, 6 M in DPBS) containing 10 μL of 10% SDS and then dissolved by sonication. Disulfides were reduced by adding 50 μL of a 1:1 mixture containing TCEP (200 mM in DPBS) pre-neutralized with potassium carbonate (600 mM DPBS) for 30 min at 37°C. Reduced thiols were then alkylated by addition of iodoacetamide (70 μL of 400 mM in DPBS) for 30 min at ambient temperature protected from light. To each solution, 130 μL of 10% SDS (in DPBS) was added and then diluted to ~0.2% SDS with DPBS (5.5 mL) and incubated with pre-equilibrated streptavidin agarose resin (100 μL 1:1 slurry, Pierce) for 1.5 hr at ambient temperature on a rotator. The streptavidin beads were collected by centrifugation (1,400 g, 1–2 min) and sequentially washed with 0.2% SDS in DPBS (1 × 5 mL), detergent-free DPBS (2 × 5 mL), and H2O (2 × 5 mL) to remove unbound protein, excess detergent, and small molecules. The resin was transferred to a Protein LoBind tube (Eppendorf) and bound proteins were digested on-bead overnight at 37°C in ~200 μL total volume containing sequencing grade porcine trypsin (2 μg, Promega) in the presence of urea (2 M in DPBS) and CaCl2 (1 mM). The proteolyzed supernatant was transferred to a fresh Protein LoBind tube, acidified with formic acid (5% final) and stored at −20°C until analyzed.
Multidimensional liquid chromatography-tandem mass spectrometry (LC/LC-MS/MS) analysis of tryptic digests
Peptides from tryptic digests were pressure loaded onto a 250c μm (inner diameter) fused silica capillary column packed with C18 resin (4 cm, Aqua 5 μm, Phenomenex). Samples were analyzed using an LTQ-Orbitrap Velos mass spectrometer (Thermo Scientific) coupled to an Agilent 1200 series quaternary pump. Peptides were eluted by two-dimensional separation on a column with a 5 μm tip [100c μm fused silica, packed with C18 (10c cm) and strong cation exchange (SCX) resin (4c cm, Phenomenex)] using a five-step ‘MudPIT’ protocol (Washburn et al., 2001) that involves 0%, 25%, 50%, 80% and 100% salt bumps of ammonium acetate (NH4OAc; 500 mM) to elute peptides stepwise from the SCX to the C18 resin followed by an increasing gradient of acetonitrile in each step (5%–100% buffer B in buffer A; buffer A: 95% H2O, 5% acetonitrile, 0.1% formic acid; buffer B: 5% H2O, 95% acetonitrile, 0.1% formic acid). The flow rate through the column was 0.25 μl/min and the voltage applied to the nano-LC electrospray ionization source was 2.5 kV. Spectra were collected in a data-dependent acquisition mode such that each scan cycle involved a single high-resolution full MS spectrum of parent ions (MS1 scan from 400–1800 m/z) collected in the orbitrap coupled to 30 CID-induced fragmentation (MS2) scans in the ion trap of the 30 most abundant parent ions from the MS1 scan. Dynamic exclusion (repeat count of 1, exclusion duration of 20 s). Parent ions with unassigned or +1 charge states by the instrument were excluded for fragmentation. All other parameters were left at default values.
Peptide and protein identification and quantification
From each of the five .raw files (one for each salt ‘bump’) generated by the instrument (Xcalibur software), the MS2 spectra for all fragmented parent ions (.ms2 file) were extracted using RAW Xtract (version 1.9.9.2; 2004 release). Each .ms2 file was searched using the ProLuCID algorithm against a reverse-concatenated, nonredundant (gene-centric) database of the human proteome (Uniprot release –11/05/2012) or mouse proteome (11/05/2012) and filtered using DTASelect 2.0 within the Integrated Proteomics Pipeline (IP2) software. All cysteine residues were specified with a static modification for carbamidomethylation (+57.0215 Da) and one oxidized methionine residue per peptide (if found) was allowed as a variable oxidation (+15.9949 Da). In addition, peptides were required to have at least one tryptic terminus. Each dataset was simultaneously searched for both light and heavy isotopologues of the same peptide by specifying the mass shift of heavy residues as static modifications on lysine (+8.0142 Da) and arginine (+10.0082 Da) in a coupled ‘heavy’ search. The precursor ion mass tolerance for a minimum envelope of three isotopic peaks was set to 50 ppm, the minimum peptide length was six residues, the false-positive rate was set at 1% or lower and at least 2 peptides of a protein must be detected in order to be advanced to the next step of analysis.
Heavy and light parent ion chromatograms associated with successfully identified peptides were extracted and compared using in-house software (CIMAGE) as previously described (Weerapana et al., 2010). Briefly, extracted MS1 ion chromatograms (±10 ppm error tolerance of predicted m/z) from both ‘light’ and ‘heavy’ target peptide masses (m/z) were generated using a retention time window (±10 min) centered on the time when the peptide ion was selected for MS/MS fragmentation (minimum 3 MS1’s per peak), and subsequently identified. Next, the ratio of the peak areas under the light and heavy signals (signal-to-noise ratio > 2.5) was calculated. Computational filters used to ensure that the correct peak-pair was used for quantification include a co-elution correlation score filter (R2 ≥ 0.8), removing target peptides with bad co-elution profile, and an ‘envelope correlation score’ filter (R2 > 0.8) that eliminates target peptides whose predicted pattern of the isotopic envelope distribution does not match the experimentally observed high-resolution MS1 spectrum. In addition, peptides detected as ‘singletons,’ where only the heavy ion of a peptide pair was identified, but that cleared all other filtering parameters, are given a default assigned ratio of ‘20,’ which is defined as any measured ratio that is ≥ 20 and is the maximum ratio reported here. Unprocessed raw data for multiple examples of each experimental type provided in Tables S1, S2, S3, and S5.
Proteomic analysis of probe-labeled proteins by mass spectrometry
Median SILAC ratios were filtered to ensure that each protein ratio was resultant from three or more unique and quantified peptides and that the combined peptide ratios possessed a standard deviation of less than 60% of the median; if greater, the combined ratio was assigned the lowest quantified peptide value. SILAC ratios meeting these criteria were then combined with replicate datasets from the same probe, cell line and experimental conditions. Identification of probe targets enriched in fragment probe versus control probe experiments in HEK293T cells represent averaged data from at least two biological replicate experiments and K562 data in single replicate experiments. Identification of probe targets from comparison of probe versus probe experiments and from fragment probe competition experiments represent averaged values of at least two biological replicate experiments. Identification of targets in 3T3-L1 cells represent averaged values from at least three biological replicate experiments, except for competition experiments with negative controls 29 and 30, which were performed in duplicate.
In order to be classified as a probe target, proteins must (1) comply with the above criteria and (2) be enriched greater than 5-fold over control probe 1 (SILAC > 5) in at least two different probe datasets (200 μM). If protein is enriched 5-fold or more by only one probe, then it had to be quantified in three or more independent experiments. In order to be included in probe-versus-probe comparisons, protein must abide by the above criteria and also be a target for at least one of the two probes, as designated above. Targets fulfilling these criteria are shown in Table S1 along with representative raw datasets. For competition experiments, proteins (1) must be designated probe targets for the probe being used, as described above, (2) competed greater than 3-fold (competition SILAC ratio > 3) unless otherwise noted, and (3) must have SILAC ratios derived from three or more quantified peptides. Targets fulfilling these criteria are shown in Table S3 along with representative raw datasets. For target deconvolution experiments done in 3T3-L1 cells (Table S5), we required targets of 25 to be labeled in a UV-dependent fashion (> 5-fold enrichment in UV versus no UV experiments), to be selectively enriched by active probe 25 over inactive probe 26 (SILAC ratio > 3), and competed by 27 (SILAC ratio > 3) but not competed by any inactive control compounds (SILAC ratio < 2). Further, we required candidate proteins be quantified with three or more unique quantified peptides in at least 75% of all datasets, which were performed under identical conditions using 25.
Fragment probe target meta-analysis
Custom python scripts were used to compile functional annotations of final probe targets available in the UniProtKB/Swiss-Prot Protein Knowledge database. Probe targets were queried against the DrugBank database (Version 4.2) and fractionated into DrugBank and non-DrugBank proteins. Functional keywords assigned at the protein level were collected from the Uniprot database and the two DrugBank and non-DrugBank categories were further classified into protein functional classes. Membrane proteins were defined as proteins possessing known or predicted transmembrane domains (UniProt analysis), and the remaining targets were considered soluble. Heatmaps were generated using RStudio software.
Cell treatments and preparation for MS-based analyses of probe-modified peptides
Preparation and analysis was adapted from methods previously reported (Backus et al., 2016; Niphakis et al., 2015; Weerapana et al., 2007). In brief, for global mapping of fragment probe-modified peptides, separate 10 cm dishes of cells were treated with probes (200–250 μM) in 3.0 mL of DMEM (serum-free) and (if applicable) competitor ligands, proteomes harvested and subjected to click chemistry conditions with either light or heavy isotopically labeled biotin-TEV-azide (10 μL of 5 mM stocks in DMSO, final concentration = 100 μM), TCEP, ligand and CuSO4 as detailed above. The samples were allowed to react for 1 hr at which point the samples were centrifuged (16,000 g, 5 min, 4°C). The resulting pellets were sonicated in ice-cold methanol (500 μL) and the resuspended light-and heavy-labeled samples were then combined and centrifuged (16,000 g, 5 min, 4°C). The pellets were then solubilized in PBS containing 1.2% SDS (1 mL) with sonication and heating (5 min, 95°C). Samples were transferred to falcon tubes containing DPBS (5 mL), to which a 100 μL of streptavidin-agarose beads slurry was added. After incubation, the beads (3hr) were pelleted by centrifugation (1,400 g, 3 min) and were washed (2 × 10 mL PBS and 2 × 10 mL water). The beads were transferred to eppendorf tubes with 1 mL DPBS, centrifuged (1,400 g, 3 min), and resuspended in PBS containing 6 M urea. To this was added 10 mM DTT (25 μL of a 200 mM stock in water) and the beads were incubated at 65°C for 15 min. 20 mM iodoacetamide (25 μL of a 400 mM stock in water) was then added and allowed to react at 37°C for 30 min with shaking. The bead mixture was diluted with 900 μL PBS, pelleted by centrifugation (1,400 g, 3 min), and resuspended in 200 μL 2M urea (DPBS) containing trypsin and CaCl2 as described above. The beads were separated from the digest by centrifugation (1,000 g, 1 min), washed (2 × 1 mL PBS and 2 × 1 mL water) and then transferred to fresh eppendorfs with 1 mL water. The washed beads were washed once further in 150 μL TEV buffer (50 mM Tris, pH 8, 0.5 mM EDTA, 1 mM DTT) by centrifugation (1,400 g, 3 min) and the resuspended in 150 μL TEV buffer. 5 μL TEV protease (80 μM) was added and the reactions were rotated overnight at 29°C. The TEV digest was separated from the beads by centrifugation (1,400 g, 3 min) and the beads were washed once with water (100 μL). The samples were then acidified to a final concentration of 5% (v/v) formic acid and stored at −80°C prior to analysis.
The resulting probe-modified peptides were collected for MS analysis, which was performed as described above with differences in the salt bumps applied in the chromatographic gradients which in this case were 0%, 30%, 60%, 90% and 100% NH4OAc (500 μM). The protein identification searches of the MS data were performed with the following changes applied to identify the peptides modified with the corresponding fragment probe and the cleaved TEV tag. All amino acids were considered as possible residues for modification. To facilitate the computational searches, sets of up to 3 amino acids were searched using ProLuCID and filtered with DTASelect as described above. The mass of the modification used to search for probe-modified peptides was +665.4013 m/z for 8, +667.3264 m/z for 4, +665.3285 m/z for 3, +678.3602 m/z for 6, +680.4122 m/z for 9, +679.4179 m/z for 13, +755.3867 m/z for 2, +655.4170 m/z for 14, +669.3598 m/z for 15, and +760.4384 m/z for 25, which are the masses for the corresponding probe plus the light TEV-tag and an additional +6.0138 m/z for the heavy counterpart. The isoTOP ratios for probe labeled peptides were quantified using the in-house software CIMAGE (Weerapana et al., 2010).
Analysis of probe labeled peptides
For protein mapping experiments, fragment probe-modified peptides were expected to show a ratio of heavy and light signals of ~1.0 (0.5 < ratio < 2.0) and were required to have been designated an enriched target (as described in the main text) by the corresponding probe in whole-protein capture experiments. For each protein in the site-of-labeling dataset, the UniProtKB accession number was used to map and collect relevant structures from the RCSB Protein Data Bank (PDB) fulfilling the following criteria: structures determined by X-ray crystallography, wild-type protein, Homo sapiens as the sole source organism. For proteins with multiple available structures, custom R scripts were used to further filter the PDB files, privileging higher sequence coverage for isoTOP peptides (see Table S2 for selected PDB accessions). Fpocket 2.0 (Le Guilloux et al., 2009) was used to detect potential binding pockets for the resultant structures with all parameters set at recommended default. Pockets with volume less than 500 Å3 were removed from output prior to further analysis. Residues surrounding fpocket predicted binding pockets for each protein were collected to determine the number of residues overlapping with isoTOP peptides. For structures with multiple chains, the average number of overlapping residues for all chains possessing isoTOP peptide was used. Custom Python scripts were used to compile functional site annotations using the UniProtKB/Swiss-Prot Protein Knowledge database (release-2016_06). Relevant UniProt entries were searched for available functional residues, specifically for annotations regarding enzyme catalytic residues (active sites), substrate binding sites, and metal-binding sites. At the isoTOP peptide level, the distances between all possible atom pairs, consisting of one atom from isoTOP peptide and the other atom from a functional site, were calculated and the minimum distance was designated as the spatial distance between isoTOP peptide and functional sites. Annotated FFF-labeled peptides and corresponding analyses shown in Table S2.
PPARγ Luciferase Reporter Assay
HEK293T cells were transiently co-transfected using Polyethylenimine (Sigma) with a UAS-Luciferase reporter and a vector expressing the heterologous GAL4 DNA binding domain (DBD) or a GAL4 DNA binding domain::PPARγ ligand binding domain (LBD) chimeric protein, and full-length PTGR2 as indicated. 24 hr after transfection, cells were treated either with vehicle (DMSO), 15k-PGE2 (20 μM), or fragment compounds. Rosiglitazone (2 μM), a synthetic PPARγ ligand, was used as control. 16 hr after incubation, cells were lysed in Cell Culture Lysis Reagent (Promega) and luciferase activity measured using the Luciferase Assay System (Promega).
Oxygen Consumption Rate Measurements
Palmitate-BSA oxidation measurements were performed using a Seahorse XFe96 Extracellular Flux Analyzer. Briefly, HSC5 cells were plated at 4.0 × 10⁴ cells/well and incubated for 24 hr in a 37°C, 5% CO2 incubator. One hour prior to the XF assay, media was changed to 1X Krebs-Henseleit buffer (111 mM NaCl, 4.7 mM KCl, 2 mM MgSO4, 1.2 mM Na2HPO4, pH 7.4) with 2.5 mM glucose, 0.5 mM carnitine, and 5 mM HEPES. 20 min after media exchange, cells were treated with either vehicle (DMSO), 24 (100 μM) or 21 (100, 50, 20 and 5 μM respectively). After 40 min, cells were given palmitate:BSA (667 μM and 167 μM respectively) or BSA alone and the XF assay was started. Perturbation compounds (oligomycin 4 μM, FCCP 4 μM, RAA 2 μM) were prepared in 1X KH buffer and injected from the reagent ports automatically onto wells.
Adipocyte Phenotypic Screen
3T3-L1 preadipocytes were induced to differentiate in the presence of 50 μM of each fragment probe. Rosiglitazone (2 μM) was used as a positive control. Media was replaced every two days and compounds refreshed. On day 8 of differentiation, cells were fixed with 4% PFA and stained with the fluorescent lipid stain Nile red (AdipoRed) and Hoechst for nuclei counterstain. Cells were imaged using a Celigo S Cell Imaging Cytometer (Nexcelom Bioscience) and compounds promoting increased lipid accumulation (i.e., fluorescence) identified. Hits were validated at two concentrations (10 μM and 50 μM) in 12-well plate format. To prepare primary brown preadipocytes, interscapular fat depots of neonatal mice were digested for 40 min at 37°C with 1.5 mg/mL collagenase type I in 61.5 mM NaCl, 2.5 mM KCl, 0.65 mM CaCl2, 2.5 mM glucose, 50 mM HEPES, 50 μg/mL penicillin-streptomycin and 2% (wt/vol) BSA. Cells were next filtered through a 100 μm cell strainer, plated in DMEM supplemented with 20 mM HEPES, 20% FBS, and penicillin/streptomycin, and grown to confluence. Cells were induced to differentiate in DMEM with 10% FBS, dexamethasone (1 μM), IBMX (0.5 mM), insulin (1 μg/ml), triiodothyronine (1 nM), and either DMSO (0.1%), 25 (10 μM), or rosiglitazone (2 μM). Two days later, media was switched and differentiating cells were maintained in DMEM, 10% FBS, insulin, triiodothyronine, and experimental compounds. Media was refreshed every 2 days. Human mesenchymal stem cells were maintained in DMEM supplemented with 10% FBS and grown to confluence. Two days after confluence, cells were induced to differentiate in media containing DMEM supplemented with 10% FBS, dexamethasone (1 μM), IBMX (0.5 mM), insulin (1 μg/ml), indomethacin (125 μM), and either DMSO (0.1%), 25 (10 μM), or rosiglitazone (2 μM) for 2 days. Media and compounds were refreshed every 2 days, alternating complete differentiation media with maintenance media (DMEM 10% FBS supplemented only with insulin) for 18 days.
RNaseq analysis
For RNA-seq, 0.6-1×10⁶ cells were collected in Trizol (Invitrogen) and total RNA was extracted using Direct-Zol RNA extraction kit (Zymo Research). PolyA+ RNA was fragmented and prepared into strand-specific libraries using the Illumina True-seq stranded RNA kit (Illumina) and analyzed on an Illumina HiSeq 2500 sequencer. Libraries were sequenced using single-end 50 bp reads at a depth of 10–15 million reads per library. Single-end sequencing reads were mapped to the mouse reference genome (mm9, NCBI37) using STAR (version 2.3.0.c, default parameters). Only reads that aligned uniquely to a single genomic location were used for downstream analysis (MAPQ > 10). Gene expression values were calculated for read counts on exons of annotated RefSeq genes using HOMER. Differentially expressed genes between GFP- and PGRMC2-overexpressing cells were calculated from three replicates per condition using EdgeR and a threshold of adjusted p value < 0.05 was used to call differentially expressed genes. Gene expression values are shown as read counts normalized to 107 mapped reads. Differentially expressed genes were used for pathway analysis. Gene ontology functional enrichment analysis was performed using Ingenuity Pathway Analysis (QIAGEN). Heatmaps were generated using RStudio software (package ‘gplots’). RNA-seq data have been deposited in the GEO repository under accession number GSE90731.
Cell viability assay
Cells were seeded in white-opaque 96-well plates in full growth media at a density of 6,000 cells/well (100 μL) and were allowed to grow for 14 hr at 37°C in a humidified 5% CO2 atmosphere. The cells were then treated with compounds or DMSO (1% DMSO final for all wells) in triplicate and incubated at 37°C in a humidified 5% CO2 atmosphere for 45 min. Note, all photoaffinity probe incubations for MS- and gel-based experiments were performed for 30 min. Cell viability was determined using the luciferase-based CellTiter-Glo Luminescent Cell Viability Assay (Promega).
Cloning and transient overexpression of proteins in HEK293T cells
Full-length genes encoding proteins of interest were PCR amplified from a cDNA library derived from low-passage HEK293T cells. Gene products were cloned into the pRK5 vector with a C-terminal FLAG tag using SalI (N-terminal) and NotI (C-terminal) restriction sites or purchased. All clone sequences were verified. To recombinantly overexpress proteins used in in situ treatments, HEK293T cells were grown to 40%–60% confluency under standard growth conditions in 6-well (for gel-based experiments) or 10 cm tissue culture plates (for MS-based experiments) and transiently transfected with 0.5–3 μg of desired construct (6-well plates) or 5 μg (10 cm plates) using polyethyleneimine ‘MAX’ (MW 40,000, PEI; Polysciences, Inc.). ‘Mock’ transfected cells were transfected with a vector containing METAP2 for 48 hr. Human SLC25A20 in a pCMV6-Entry vector with a C-terminal DDK tag was purchased from Origene. Empty pCMV-Entry vector was used as ‘mock’ control for experiments with SLC25A20. Human PGRMC2 in a pLX304 vector with a C-terminal V5 tag was acquired from The ORFeome Collaboration. The pRK5 vector was a gift from David Sabatini (MIT).
Lentiviral infection
3T3-L1 preadipocytes were infected overnight at 70% confluence in 10 cm Petri dishes with lentiviruses expressing a non-targeting scramble shRNA or two different shRNAs against mouse PGRMC2. Two days after infection, cells were re-plated into 12-well plates and grown to confluence. Two days after confluence, cells were induced to differentiate in presence of dexamethasone (1 μM), IBMX (0.5 mM), insulin (1 μg/ml) and either DMSO (0.1%), test compound (10 μM), or Rosiglitazone (2 μM). Cells were stained at day 7 of differentiation with Nile Red and Hoechst, imaged and harvested for RNA and protein extraction. For rescue experiments, scramble and PGRMC2 knockdown cells were co-infected with lentiviruses overexpressing human V5-tagged PGRMC2. 3T3-L1 preadipocytes stably overexpressing GFP or hPGRMC2 were selected with blasticidin (20 μg/ml) for 10 days and maintained in culture in 10% BCS.
In vitro gel-based competition of FFF probe 25 labeling of PGRMC2
HEK293T cells were transfected, as described above, with human PGRMC2 and lysed 48 hr later. Lysates (1 mg/mL) were treated with probe 25 and indicated competitor or DMSO for 30 min at room temperature in a clear 96-well flat bottom plate. The samples were irridated with UV light and conjugated to TAMRA-N3 as described above. Reactions were allowed to proceed at ambient temperature for 1 hr before quenching them with SDS loading buffer (4X stock, 17 μL). Proteins (25 μg total protein loaded per gel lane) were resolved using SDS-PAGE (10% acrylamide) and visualized by in-gel fluorescence on a Hitachi FMBIO-II or a Bio-Rad ChemiDoc™ MP flatbed fluorescence scanner. PGRMC2 competition was quantitatively assessed by measuring fluorescence intensity of the corresponding gel band using Image Lab (v 5.2.1) relative to DMSO treated samples.
Confocal Imaging of PGRMC2
For immunostaining, 3T3-L1 cells were grown on gelatin-coated cover glasses, fixed in 4%PFA, permeabilized in 0.5% Triton-PBS and blocked with 5% FBS-PBS solution. Rabbit anti-PGRMC2 (Bethyl Labs) and mouse KDEL monoclonal antibody (clone 10C3, Enzo Life Sciences) were diluted at 0.4 μg/ml and 1ug/ml using blocking buffer and samples were incubated overnight at 4°C in a humidified chamber. Alexafluor-488 anti-rabbit and alexafluor-568 anti-mouse secondary antibodies were diluted 1:500 in blocking buffer and samples incubated for 1 hr at RT. Nuclei and actin filaments were stained by Hoechst and Acti-stain 670 phalloidin dyes, respectively. Cells were washed 3 times with PBS for 10 min after each incubation. Images were acquired with a Zeiss LSM 710 laser scanning confocal microscope and analyzed with IMARIS (Bitplane Inc.) and Adobe Photoshop CS3 (Adobe Systems Incorporated) software.
Western blot analysis
After scanning for fluorescence, proteins were transferred to a nitrocellulose membrane in Towbin buffer, the membrane was blocked for ~1 hr at ambient temperature with 5% nonfat dry milk (w/v) or 5% BSA in Tris-buffered saline with Tween 20 (TBST) and incubated with primary antibodies in the same solution overnight at 4°C. Blots were washed (3 × 5 min, TBST), incubated with secondary antibodies (IRDye 800CW or HRP-conjugated anti-mouse and anti-rabbit) in milk or BSA for 1 hr at ambient temperature, washed (3 × 5 min, TBST), rinsed in water and visualized on a LICOR Odyssey Scanner or resolved by film exposure.
Gene expression analysis
Total RNA was isolated from cells using Direct-zol RNA MiniPrep Plus (Zymo Research). Taqman-based quantitative real-time PCR was performed using the SuperScript III Platinum One-Step qRT-PCR reagent (Thermo Fisher Scientific). Samples were run in triplicate as multiplexed reactions and normalized to an internal control (36B4; acidic ribosomal phosphoprotein P0 mRNA).
In vitro LCMS-based activity assay for PTGR2
Aliquots (1 μL) of test compounds dissolved in DMSO were transferred to 1.5 mL eppendorf tubes followed by addition of recombinant human PTGR2 (44 μL, 200 nM final concentration) in freshly prepared reaction buffer (Tris Buffer, 1mM EDTA, 50 μM TCEP, 300 μM NADPH). The resulting mixture was vortexed and then incubated at 37°C for 20 min. Next, a 5 μL solution of 15-keto-PGE2 substrate (20 μM final concentration) in reaction buffer was added and the reaction was allowed to proceed for 30 min at 37°C. Reactions were quenched by the addition of 0.5% AcOH in ethyl acetate (800 μL), water (300 μL) and 100 μL of internal standard PGE2-d4 (30 pmol/sample)dissolvedin1:1 methanol/water. Phaseswereseparatedbycentrifugation and the organiclayer was collectedand dried under a stream of N2, then stored at −80°C until analysis. Directly prior to analysis, samples were reconstituted in 100 μL of MeCN:H2O (1:1, v/v) and analyzed by LC/MS/MS. All conditions were performed in triplicate and repeated at least three independent times.
Extracts were analyzed in negative mode using an Agilent 6460 Triple Quadrupole LC/MS system and LC separation was performed on a Kinetex 5 μm C18 100A, 50×4.6 mm column. Mobile phase A was composed of 70:30:0.1 H2O/acetonitrile/formic acid and mobile phase B was composed of 50:50:0.1 isopropyl alcohol/acetonitrile/formic acid. Following injection (15 μL), samples were eluted with a constant flow rate (600 μL/min) using the following gradient: Mobile phase A (100%), 0–1 min; B increased linearly to 20%, 1–2 min and held constant 2–4 min; B increased linearly to 100%, 4–7 min and held constant from 7–11 min; B decreased to 0% 11.0–11.1 min and held constant 11.1–13 min. To minimize carryover, LC solvents were cycled between 100% Mobile Phase A and 100% Mobile Phase B over 5 min after each run. The following MS parameters were used to measure the indicated metabolites by MRM (precursor ion, product ion, collision energy): PGE2-d4 (355, 275, 18), 13,14-dihydro-15-keto-PGE2 (351, 333, 18) and 15-keto-PGE2 (349, 161, 20). 15-keto-PGE2 and 13,14-dihydro-15-keto-PGE2 levels were quantified by determining peak areas in relation to internal standard PGE2-d4. Non-deuterated 15-keto-PGE2 and 13,14-dihydro-15-keto-PGE2 standards were used to confirm retention time and fragmentation.
LCMS analysis of acylcarnitines in HSC-5 cells
HSC-5 cells were seeded in 10 cm plates and grown to ~90% confluence. Media was aspirated, cells were washed carefully with DPBS (3mL) and resuspended in freshly-prepared serum-free IMDM media containing test compound(s) or vehicle. After incubation at 37°C for 3 hr, the media was removed and cells were washed with cold DPBS (2 × 3mL). Cells were scraped in 4 mL cold DPBS, transferred to a falcon tube and centrifuged at 2000 rpm for 8 min, and resuspended in 1mL cold DPBS. Cells were lysed using a probe sonicator, and 1 mL of lysates normalized to 1.5mg/mL was transferred to 2-dram glass vials. MeCN (3 mL) containing acyl carnitine internal standard mix (Cambridge Isotope Laboratories) was added to lysates and vigorously vortexed. Internal standards include 2H9-carnitine (2.28 nmol); 2H3-acetyl carnitine (C2, 570 pmol); 2H3 propionyl carnitine (C3, 120 pmol); 2H3butryl carnitine (C4, 120 pmol); 2H9 isovaleryl carnitine (C5, 120 pmol); 2H3 octanoyl carnitine (C8, 120 pmol); 2H9 myristoyl carnitine (C14, 120 pmol); 2H3 palmitoyl carnitine (C16, 240 pmol). Samples were centrifuged at 1000 rpm for 5 min to pellet insoluble precipitate, and the remaining eluent carefully transferred to fresh 2-dram vials to avoid disturbing the precipitate. The eluent was concentrated under a stream of N2, and samples were stored at −80°C until analysis. Directly prior to analysis, samples were reconstituted in 500 uL of MeCN:H2O (1:1, v/v) and analyzed by LC/MS/MS. The indicated acyl carnitines were quantified by measuring the area under the peak relative to an internal standard (2H3 palmitoyl carnitine for C16, C18 and C18:1; 2H9 myristoyl carnitine for C12 and C14; 2H3 octanoyl carnitine for C5DC and C4DC; 2H9 isovaleryl carnitine for C5 and C7).
Extracts were analyzed in positive mode using an Agilent 6460 Triple Quadrupole LC/MS system and LC separation was performed on a Kinetex 5 μm C18 100A, 50×4.6 mm column. Mobile phase A was composed of 95:5:0.1 H2O/methanol/formic acid and mobile phase B was composed of 60:35:5:0.1 isopropyl alcohol/methanol/H2O/formic acid. Following injection (15 μL), samples were eluted with an initial constant flow rate of 100 μL/min in 100% mobile phase A (0–5 min) and further eluted using the following gradient: Mobile phase A (100%, 400 μL/min), 5–7 min; B increased linearly to 100% (400 μL/min), 7–30 min and held constant 30–38 min (with increased flow of 500 μL/min); B decreased immediately to 0%, and held constant 38–42min; B increased linearly to 100%, 42–46 min and held constant 46–50 min; B decreased linearly to 0%, 50–54 min and held constant 54–57 min. To minimize carryover, LC solvents were cycled between 100% Mobile Phase A and 100% Mobile Phase B over 5 min after each run. The following MS parameters were used to measure the indicated metabolites by MRM (precursor ion, product ion): C12 (344.2, 85.1), C14 (372.3, 85.1), C16 (400.3, 85.1), C18:1 (426.3, 85.1), C18 (428.3, 85.1), C4DC (318.2, 85.1), C5 (246.1, 85.1), C10-OH (332.2, 85.1), C7 (274.1, 85.1), D3 acetyl (207.1, 85.1), D3 butyryl (235.1, 85.1), D3 octanoyl (291.1, 85.1), D3 palmitoyl (403.3, 85.1), D3 propionyl (221.1, 85.1), D9 isovaleryl (255.1, 85.1), and D9 myristoyl (381.3, 85.1).
Chemistry Materials
Purchased starting materials were used as received unless otherwise noted. All moisture sensitive reactions were performed in an inert, dry atmosphere of nitrogen in flame dried glassware. Reagent grade solvents were used for extractions and flash chromatography. All amines used in probe library synthesis are available from commercial vendors. All fragment-based competitors were synthesized or purchased through Sigma Aldrich Market Select vendors. Reaction progress was checked by analytical thin-layer chromatography (TLC, Merck silica gel 60 F-254 plates). The plates were monitored either with UV illumination, or by charring with anisaldehyde (2.5% p-anisaldehyde, 1% AcOH, 3.5% H2SO4 (conc.) in 95% EtOH) or ninhydrin (0.3% ninhydrin (w/v), 97:3 EtOH-AcOH) stains. Flash column chromatography was performed using silica gel (F60, 40–63um, 60A). Preparative thin layer chromotography (PTLC) was carried out using glass backed PTLC plates 1000–2000 μm thickness (Analtech). The solvent compositions reported for all chromatographic separations are on a volume/volume (v/v) basis. 1H-NMR spectra were recorded at either 400, 500 or 600 MHz and are reported in parts per million (ppm) on the δ scale relative to CDCl3 (δ 7.26) as an internal standard. Data are reported as follows: chemical shift, multiplicity (s = singlet, d = doublet, t = triplet, q = quartet, br = broad, m = multiplet), coupling constants (Hz), and integration. 13C-NMR spectra were recorded at either 100 or 125 MHz and are reported in parts per million (ppm) on the δ scale relative to CDCl3 (δ 77.00). See Data S1 for NMR spectra of synthesized compounds. Mass spectrometry data were collected on a HP1100 single-quadrupole instrument (ESI; low resolution) or an Agilent ESI-TOF instrument (HRMS).
Compound Synthesis and Characterization

ethyl 4-oxooct-7-ynoate (S4)
A solution of crude pent-4-ynal (freshly synthesized) (17.2 g, 210 mmol) and ethyl acrylate (45.5 mL, 420 mmol, 2 equiv) in dioxane (250 mL) was added dropwise over a period of 4 hr to a suspension of 3-benzyl-5-(2-hydroxyethyl)-4-methylthiaolium chloride, triethylamine (20.4 mL, 147 mmol, 0.7 equiv) and ethyl acrylate (45.5mL) in dioxane (300 mL) at 80°C under an atmosphere of nitrogen. The mixture was stirred and heated at 80°C for 54 hr and then volatiles removed by rotary evaporation. Residue resuspended in methylene chloride (600 mL) and washed with aqueous 10% H2SO4 (150 mL), saturated aqueous NaHCO3 (250 mL) and brine (250 mL), then dried over anhydrous Na2SO4 and volatiles removed by rotary evaporation. Crude S4 was purified by flash column chromatography (100% hexanes⟶ 5% ⟶ 10% ⟶ 15% ⟶ 20% ethyl acetate in hexanes), resulting in S4 as a light brown oil (10.7 g, 28%). 1H NMR (400 MHz, CDCl3) δ 4.20 (q, J = 7.1, 2H), 2.86 – 2.76 (m, 4H), 2.68 (t, J = 6.5, 2H), 2.54 (td, J = 2.6, 7.3, 2H), 2.04 (t, J = 2.7, 1H), 1.33 (td, J = 2.2, 7.2, 4H). MS (ESI) calc’d for [M+H]+ C10H15O3+ 183.1, found 183.1.

4-oxooct-7-ynoic acid (S5)
To a solution of S4 (9.46 g, 52 mmol) in methanol (400 mL), added LiOH (6.2 g, 260 mmol, 5 equiv) and water (4.8 mL, 267 mmol, 5.1 equiv) and let resulting solution stir at room temperature for 15 hr when TLC (3:1 hexanes/ethyl acetate) indicated the complete consumption of starting material. The solution was carefully acidified with aqueous HCl (6 M) until a pH of ~3 was achieved. The resulting solution was then extracted with methylene chloride and the combined organic layers were dried over anydrous Na2SO4 and volatiles were removed by rotary evaporation, resulting in S5 as a brown solid (7.6 g, 95%), which was used without further purification. 1H NMR (400 MHz, CDCl3) δ 2.90 – 2.57 (m, 6H), 2.48 (td, J = 2.5, 7.3, 2H), 1.98 (t, J = 2.5, 1H). MS (ESI) calc’d for [M-H]- C8H9O3− 153.0, found 153.0.

3-(3-(but-3-yn-1-yl)-3H-diazirin-3-yl)propanoic acid (S6)
A dried round bottom flask containing S5 (3.1 g, 20 mmol) cooled to 0°C was charged with 7N NH3 in methanol (195 mL) and resulting solution was stirred at 0°C under an atmosphere of nitrogen for 3 hr. At this time, a solution of hydroxylamine-O-sulfonic acid (3.2 g, 28.2 mmol, 1.4 equiv) in anhydrous methanol (25 mL) was added dropwise via addition funnel at 0°C. The resulting solution was stirred at 0°C for an additional 1 hr and then allowed to warm to room temperature over 14 hr. Resulting suspension was evaporated to dryness and resuspended in methanol (30 mL) and solid was filtered and washed several times with methanol. The combined filtrate was evaporated and resuspended in anhydrous methanol (180 mL), then cooled to 0°C (protected from light). Diisopropylethylamine (7.8 mL) was added, followed by iodine (portion-wise), until a dark brown color persisted for more than 30 min, indicating total oxidation of diaziridine. The solution was then diluted with ethyl acetate (200 mL) and washed with aq. 1N HCl (200 mL), saturated aqueous Na2S2O3 (3 × 200 mL or until organic phase clarified) and brine. Combined aqueous phases were washed once with ethyl acetate and all organic layers were combined, then dried over anhydrous Na2SO4 and volatiles removed by rotary evaporation. Crude S6 was purified by flash column chromatography (100% hexanes ⟶2% ⟶ 5% ⟶ 10% ⟶20% ethyl acetate in hexanes), resulting in S6 as a colorless oil (889 mg, 27%). 1H NMR (400 MHz, CDCl3) δ 2.18 (t, J = 7.7, 2H), 2.06 – 1.98 (m, 3H), 1.81 (t, J = 7.7, 2H), 1.66 (t, J = 7.4, 2H). 13C NMR (101 MHz, CDCl3) δ 178.63, 82.56, 69.37, 32.16, 28.21, 27.72, 27.46, 13.21. MS (ESI) calc’d for [M-H]- C8H9N2O2− 165.1, found 165.1. Characterization matches that previously reported. (Li et al., 2013)

General Procedure 1: coupling procedure for the synthesis of simple fragment-based probes (Figure 1B, 1–15)
To a 4 mL vial containing 3-(3-(but-3-yn-1-yl)-3H-diazirin-3-yl)propanoic acid (S6, 1 eq.) in DCM (60 mM relative to S6), commercially available amine (1.1 eq.) DIPEA (3.0 eq.) EDC-HCl (1.5 eq.) and HOBt (1.5 eq.) were added. Reaction mixtures were stirred at room temperature for 4 hr to overnight when TLC indicated reaction completed. The crude samples were diluted with DCM (10 mL for 20mg of S6) and washed first with saturated aqueous NH4Cl (10 mL) and saturated aqueous NaHCO3 (10 mL), then dried over anhydrous Na2SO4 and volatiles removed by rotary evaporation. Crude products were purified by PTLC or flash column chromatography.
General Procedure 2: coupling procedure for the synthesis of photoaffinity probe library used in phenotypic screening (Figure S6A and Table S4)
A 4 mL vial was charged with 3-(3-(but-3-yn-1-yl)-3H-diazirin-3-yl)propanoic acid (10 mg, 0.060 mmol) or propionic acid (0.060 mmol), commercially available amine (0.060 mmol, 1 eq.) DIPEA (0.032 mL, 0.181 mmol, 3.0 eq.), HATU (34.3 mg, 0.090 mmol, 1.5 eq.) and DMF (1 mL). Reaction mixtures were stirred at room temperature for 4 hr. The crude samples were diluted with methanol to a total volume of 1.6 mL then purified by reverse phase HPLC using a Xbridge Prep C18 19×150 mm (10 μm) column. Mobile phase A was composed of 10 mM ammonium acetate in water and mobile phase B was composed of acetonitrile. Samples were eluted with an initial constant flow rate of 15 mL/min using the following gradient: 10% B to 100% B over 20 min followed by a 3 min wash at 100% B and 2 min equilibration at 10% B. See Table S4 for structures and LC/MS characterization. A representative subset (165 diazirine probes and 114 propanamide analogs) of the library was characterized by 1H NMR (Data S1) and LC/MS (10 with HRMS for each library class).

3-(3-(but-3-yn-1-yl)-3H-diazirin-3-yl)-N-methylpropanamide (1)
General Procedure 1. Purified by SiO2 flash chromatography (Hexane/EtOAc, 7:3 ⟶ 1:1) to afford 1 as a colorless sticky solid (6 mg, 93%). 1H NMR (400 MHz, CDCl3) δ 5.56 (brs, 1H), 2.82 (d, J = 2.2 Hz, 2H), 2.08 – 1.98 (m, 3H), 1.94 (m, 2H), 1.90 – 1.83 (m, 2H), 1.66 (t, J = 7.4 Hz, 2H). 13C NMR (126 MHz, CDCl3) δ 172.12, 83.09, 69.57, 32.79, 30.58, 28.83, 28.25, 26.80, 13.68. HRMS (ESI-TOF) calcd for C19H14N3O 180.1131 (M+H+), found 180.1131.

3-(3-(but-3-yn-1-yl)-3H-diazirin-3-yl)-N-(2-oxo-5-phenyl-2,3-dihydro-1H-benzo[e][1,4]diazepin-3-yl)propanamide (2)
General Procedure 1. Purified by SiO2 flash chromatography (Hexane/EtOAc, 3:1) to afford 2 as a white sticky solid (22 mg, 76%). 1H NMR (400 MHz, CDCl3) δ 9.18 (s, 1H), 7.56-7.30 (m, 8H), 7.22-7.10 (m, 2H), 5.53 (d, J = 7.9 Hz, 1H), 2.29-2.13 (m, 2H), 2.07-1.97 (m, 3H), 1.87 (t, J = 7.4 Hz, 2H), 1.68 (t, J = 7.4 Hz, 2H). 13C NMR (101 MHz, CDCl3) δ 171.34, 168.74, 138.54, 137.36, 132.21, 131.45, 130.69, 129.87, 128.25, 127.61, 124.18, 121.46, 82.76, 69.26, 67.13, 32.30, 30.37, 28.30, 27.87, 13.33. HRMS (ESI-TOF) calcd for C23H22N5O2 400.1768 (M+H+), found 400.1768.

3-(3-(but-3-yn-1-yl)-3H-diazirin-3-yl)-N-(2-oxo-2H-chromen-6-yl)propanamide (3)
General Procedure 1. Purified by SiO2 flash chromatography (Hexane/EtOAc, 3:2) to afford 3 as a yellow sticky solid (12.8 mg, 57%).1H NMR (400 MHz, CDCl3) δ 8.01 (d, J = 2.2 Hz, 1H), 7.69 (d, J = 9.6 Hz, 1H), 7.62 (br s, 1H), 7.42 (dd, J = 8.9, 2.5 Hz, 1H), 7.29 (d, 7.7 Hz, 1H), 6.44 (d, J = 9.6 Hz, 1H), 2.16 (t, J = 7.5 Hz, 2H), 2.04 (td, J = 7.4, 2.6 Hz, 2H), 2.01-1.92 (m, 3H), 1.75 δ 1.62 (m, 2H). 13C NMR (101 MHz, CDCl3) δ 169.69, 160.82, 150.48, 143.49, 134.28, 123.57, 119.04, 118.58, 117.20, 82.67, 69.33, 32.44, 31.16, 28.09, 27.80, 13.29. HRMS (ESI-TOF) calcd for C17H16N3O3 310.1186 (M+H+), found 310.1186.

N-(benzo[b]thiophen-5-ylmethyl)-3-(3-(but-3-yn-1-yl)-3H-diazirin-3-yl)propanamide (4)
General Procedure 1. Purified by SiO2 flash chromatography (Hexane/EtOAc, 3:1) to afford 4 as a off-white sticky solid (12.3 mg, 44%). 1H NMR (500 MHz, CDCl3) δ 7.84 (d, J = 8.3 Hz, 1H), 7.73 (s, 1H), 7.46 (d, J = 5.4 Hz, 1H), 7.30 (d, J = 5.4 Hz, 1H), 7.26 (d, J = 8.0 Hz, 1H), 5.80 (br s, 1H), 4.54 (d, J = 5.7 Hz, 2H), 2.03-1.95 (m, 5H), 1.91 δ 1.86 (m, 2H), 1.64 (t, J = 7.5 Hz, 2H). 13C NMR (126 MHz, CDCl3) δ 171.27, 140.32, 139.41, 134.65, 127.61, 124.71, 124.06, 123.22, 83.10, 69.62, 44.23, 32.82, 30.73, 28.75, 13.70. HRMS (ESI-TOF) calcd for C17H18N3OS 312.1165 (M+H+), found 312.1167

N-(benzofuran-5-ylmethyl)-3-(3-(but-3-yn-1-yl)-3H-diazirin-3-yl)propanamide (5)
General Procedure 1. Purified by PTLC (Hexane/EtOAc, 3:1) to afford 5 as a off-white sticky solid (10.8 mg, 76%). 1H NMR (400 MHz, CDCl3) δ 7.63 (d, J = 2.2 Hz, 1H), 7.54-7.49 (m, 1H), 7.46 (d, J = 8.5 Hz, 1H), 7.21 (dd, J = 8.5, 1.8 Hz, 1H), 6.74 (dd, J = 2.2, 1.0 Hz, 1H), 5.75 (brs, 1H), 4.51 (d, J = 5.7 Hz, 2H), 2.06-1.83 (m, 7H), 1.65 (t, J = 7.4 Hz, 2H). HRMS (ESI-TOF) calcd for C17H18N3O2 296.1393 (M+H+), found 296.1392

3-(3-(but-3-yn-1-yl)-3H-diazirin-3-yl)-N-(1-methyl-2-oxo-1,2,3,4-tetrahydroquinolin-7-yl)propanamide (6)
General Procedure 1. Purified by SiO2 flash chromatography (Hexane/EtOAc, 3:1) to afford 6 as a light brown sticky solid (33 mg, 56%). 1H NMR (500 MHz, CDCl3) δ 7.43 (d,2.4 Hz, 1H), 7.35 (brs, 1H), 7.29 (dd, J = 8.7, 2.5 Hz, 1H), 6.91 (d, J = 8.7 Hz, 1H), 3.33 (s, 3H), 2.99-2.89 (m, 2H), 2.76-2.65 (m, 2H), 2.19 (t, J = 7.5, 6.7 Hz, 2H), 2.12 (td, J = 7.4, 2.6 Hz, 2H), 2.07 (t, J = 2.6 Hz, 1H), 2.02 (t, J = 7.5 Hz, 2H), 1.76(t, J = 7.5 Hz, 2H). 13C NMR (126 MHz, CDCl3) δ 170.59, 169.79, 137.62, 133.17, 127.38, 120.28, 119.32, 115.38, 83.09, 69.69, 32.87, 31.99, 31.58, 29.98, 28.61, 28.23, 25.88, 13.71. HRMS (ESI-TOF) calcd for C18H21N4O2 325.1659 (M+H+), found 325.1658

N-((1H-indol-5-yl)methyl)-3-(3-(but-3-yn-1-yl)-3H-diazirin-3-yl)propanamide (7)
General Procedure 1. Purified by PTLC (Hexane/EtOAc, 3:1) to afford 7 as an off-white sticky solid (12.2 mg, 57%). 1H NMR (500 MHz, CDCl3) δ 8.31 (brs, 1H), 7.57-7.50 (m, 1H), 7.36 (d, J = 8.3 Hz, 1H), 7.22 (dd, J = 3.2, 2.4 Hz, 1H), 7.11 (dd, J = 8.3, 1.7 Hz, 1H), 6.53-6.51 (m, 1H), 5.71 (brs, 1H), 4.50 (d, J = 5.4 Hz, 2H), 2.00 (td, J = 7.4, 2.6 Hz, 2H), 1.98-1.92 (m, 3H), 1.89-1.84 (m, 2H), 1.64 (t, J = 7.4 Hz, 2H). 13C NMR (126 MHz, CDCl3) δ 171.11, 135.68, 129.70, 128.47, 125.34, 122.74, 120.65, 111.79, 102.96, 83.14, 69.61, 44.83, 32.78, 30.79, 28.86, 13.70. HRMS (ESI-TOF) calcd for C17H19N4O 295.1553 (M+H+), found 295.1555.

3-(3-(but-3-yn-1-yl)-3H-diazirin-3-yl)-1-(4-phenylpiperidin-1-yl)propan-1-one (8)
General Procedure 1. Purified by SiO2 flash chromatography (Hexane/EtOAc, 3:1) to afford 6 as an off-white sticky solid (19.7 mg, 88%). 1H NMR (400 MHz, CDCl3) δ 7.31 (t, J = 7.5 Hz, 2H), 7.25-7.16 (m, 3H), 4.85-4.69 (m, 1H), 3.92-3.83 (m, 1H), 3.10 (apparent td, J = 13.3, 2.7 Hz, 1H), 2.73 (apparent tt, J = 12.2, 3.7 Hz, 1H), 3.62 (apparent td, J = 13.3, 2.8 Hz, 1H), 2.13-2.08 (m, 2H), 2.05 (td, J = 7.5, 2.7 Hz, 2H), 1.98 (t, J = 2.6 Hz, 1H), 1.92-1.84 (m, 2H), 1.69 (t, J = 7.5 Hz, 2H) (rotomeric isomers present). 13C NMR (101 MHz, CDCl3) δ 169.33, 145.08, 128.59, 126.70, 126.54, 82.80, 69.12, 46.09, 42.75, 42.55, 33.81, 32.80, 32.57, 28.08, 26.99, 13.34. HRMS (ESI-TOF) calcd for C19H23N3O 310.1914 (M+H+), found 310.1916.

3-(3-(but-3-yn-1-yl)-3H-diazirin-3-yl)-N-(4-(piperidin-4-yl)phenyl)propanamide (9)
Followed General Procedure 1 for amide bond coupling. Crude 9 was then re-dissolved in DCM (1 mL) and TFA (300 μL) was carefully added. Resulting mixture was evaporated and crude 9 was purified by PTLC (DCM/MeOH, 6:1) yielding 9 as a white solid (22 mg, 67%, 2 steps). 1H NMR (500 MHz, CDCl3) δ 7.44 (d, J = 8.1 Hz, 2H), 7.18 (d, J = 8.2 Hz, 2H), 7.13 (s, 1H), 3.45 (d, J = 12.7 Hz, 2H), 3.00–2.89 (m, 2H), 2.76-2.65(m, 3H), 2.12 (t, J = 7.5 Hz, 2H), 2.04 (td, J = 7.5, 2.6 Hz, 2H), 2.02–1 0.91 (m, 3H), 1.68 (t, J = 7.4 Hz, 2H). HRMS (ESI-TOF) calcd for C19H25N4O 325.2023 (M+H+), found 325.2023.

N-([1,1′-biphenyl]-4-ylmethyl)-3-(3-(but-3-yn-1-yl)-3H-diazirin-3-yl)propanamide (10)
General Procedure 1. Purified by PTLC (Hexane/EtOAc, 4:1) to afford 10 as a white sticky solid (18.5 mg, 78%). 1H NMR (400 MHz, CDCl3) δ 7.61-7.52 (m, 4H), 7.44 (t, J = 7.5 Hz, 2H), 7.38–7.33 (m, 4H), 5.77 (br s, 1H), 4.47 (d, J = 5.7 Hz, 2H), 2.09-1.94 (m, 5H), 1.94-1.85 (m, 2H), 1.66 (t, J = 7.4 Hz, 2H). 13C NMR (101 MHz, CDCl3) δ 170.92, 140.63, 137.05, 128.80, 128.32, 127.48, 127.39, 127.06,82.70, 69.22, 43.47, 32.42, 30.32, 28.34, 27.86, 13.31. HRMS (ESI-TOF) calcd for C21H22N3O 332.1757 (M+H+), found 332.1755.

1-(4-benzhydrylpiperazin-1-yl)-3-(3-(but-3-yn-1-yl)-3H-diazirin-3-yl)propan-1-one (11)
General Procedure 1. Purified by PTLC (DCM/MeOH, 20:1) to afford 11 as an off-white sticky residue (12 mg, 75%). 1H NMR (500 MHz, CDCl3) δ 7.43–7.38 (m, 4H), 7.31-7.24 (m, 4H), 7.22–7.16 (m, 2H), 4.23 (s, 1H), 3.66-3.54 (m, 2H), 3.48-3.34 (m, 2H), 2.36 (apparent t, J = 5.0 Hz, 4H), 2.06–1.98 (m, 4H), 1.96 (t, J = 2.7 Hz, 1H), 1.85-1.80 (m, 2H), 1.65 (t, J = 7.4 Hz, 2H). 13C NMR (126 MHz, CDCl3) δ 169.84, 142.47, 129.01, 128.25, 127.58, 69.52, 52.34, 51.93, 45.96, 42.33, 32.93, 28.41, 27.22, 13.71. HRMS (ESI-TOF) calcd for C25H29N4O 401.2336 (M+H+), found 401.2335.

3-(3-(but-3-yn-1-yl)-3H-diazirin-3-yl)-N-(4-((4-methylpiperazin-1-yl)methyl)phenyl)propanamide (12)
General Procedure 1. Purified byPTLC (DCM/MeOH,9:1)to afford12as anoff-white stickysolid (16 mg, 76%). 1H NMR (500 MHz,CDCl3) δ 7.51 (s, 1H), 7.45 (d, J = 8.1 Hz, 2H), 7.25 (d, J = 8.3 Hz, 2H), 3.47 (s, 2H), 2.36 (s, 3H), 2.12 (t, J = 7.5 Hz, 2H), 2.02 (td, J = 7.4, 2.7 Hz, 2H), 1.98 (t, J = 2.6 Hz, 1H), 1.92 (t, J = 7.5 Hz, 2H), 1.67 (t, J = 7.4 Hz, 2H). 13C NMR (126 MHz, CDCl3) δ 169.83, 137.24, 130.20, 120.29, 83.11, 62.59, 55.21, 52.68, 45.93, 32.84, 31.64, 28.63, 28.26, 13.71. HRMS (ESI-TOF) calcd for C20H28N5O 354.2288 (M+H+), found 354.2289.

1-(2-benzylpiperidin-1-yl)-3-(3-(but-3-yn-1-yl)-3H-diazirin-3-yl)propan-1-one (13)
General Procedure 1. Purified by PTLC (Hexane/EtOAc, 1:1) to afford 13 as an off-white sticky solid (9 mg, 77%). 1H NMR (500 MHz, CDCl3) δ 7.35-7.15 (m, 3H), 7.11 (apparent d, J = 7.4 Hz, 2H), 5.14-4.95(m, 0.5H), 4.68-4.57 (m, 0.5H), 4.13-3.97 (m, 0.5H), 3.63-3.50 (m, 0.5H), 3.21-3.02 (m, 1H), 2.89–2.69 (m, 2H), 2.09-1.87 (m, 4H), 1.83-1.24 (m, 11H). 13C NMR (126 MHz, CDCl3) δ 169.99, 139.08, 139.01, 129.61, 129.46, 129.19, 128.73, 127.17, 126.63, 83.19, 69.49, 69.42, 55.55, 50.01, 41.70, 37.16, 37.04, 36.10, 32.88, 32.70, 29.92, 28.49, 28.46, 28.18, 27.78, 26.86, 26.47, 26.45, 25.89, 19.67, 19.27, 13.72, 13.70. Note: rotomeric isomers observed. HRMS (ESI-TOF) calcd for C20H26N3O 324.2070 (M+H+), found 324.2068.

N-((3 s,5 s,7 s)-adamantan-1-yl)-3-(3-(but-3-yn-1-yl)-3H-diazirin-3-yl)propanamide (14)
General Procedure 1. Purified by SiO2 flash chromatography (Hexane/EtOAc, 10:1 ⟶ 6:1 ⟶ 3:1) to afford 14 as a colorless sticky solid (14.7 mg, 68%). 1H NMR (500 MHz, CDCl3) δ 5.08 (brs, 1H), 2.15 (m, 3H), 2.04-1.95 (m, 9H), 1.88-1.75 (m, 4H), 1.72-1.59 (m, 8H). 13C NMR (126 MHz, CDCl3) δ 170.46, 83.17, 69.52, 52.41, 42.02, 36.74, 32.89, 31.69, 29.86, 29.84, 28.73, 13.71. HRMS (ESI-TOF) calcd for C28H26N3O 300.2070 (M+H+), found 300.2067.

N-(2-(benzo[d][1,3]dioxol-5-yl)ethyl)-3-(3-(but-3-yn-1-yl)-3H-diazirin-3-yl)propanamide (15)
General Procedure 1. Purified by SiO2 flash chromatography (Hexane/EtOAc, 3:1) to afford 15 as a white solid (20.2 mg, 71%). 1H NMR (500 MHz, CDCl3) δ 6.74 (d, J = 7.9 Hz, 1H), 6.67 (d, J = 1.7 Hz, 1H), 6.62 (dd, J = 7.9, 1.7 Hz, 1H), 5.93 (s, 2H), 5.43 (d, J = 7.4 Hz, 1H), 3.45 (td, J = 6.9, 5.8 Hz, 2H), 2.72 (t, J = 6.9 Hz, 2H), 2.01 (td, J = 7.4, 2.7 Hz, 2H), 1.96 (t, J = 2.6 Hz, 1H), 1.90 δ 1.78 (m, 4H), 1.62 (t, J = 7.4 Hz, 2H). 13C NMR (126 MHz, CDCl3) δ 171.37, 148.27, 146.65, 132.85, 122.01, 109.43, 108.79, 101.34, 83.10, 69.59, 41.21, 35.71, 32.81, 30.74, 28.72, 13.69. HRMS (ESI-TOF) calcd for C17H20N3O3 314.1499 (M+H+), found 314.1500

(S)-2-(3-(3-(but-3-yn-1-yl)-3H-diazirin-3-yl)propanamido)-4-methyl-N-(naphthalen-2-yl)pentanamide (25)
General Procedure 1. Purified by SiO2 flash chromatography (Hexane/EtOAc, 3:1) to afford 25 as a white solid (27 mg, 53%). 1H NMR (500 MHz, CDCl3) δ 9.39 (s, 1H), 8.20 (d, J = 2.2 Hz, 1H), 7.70-7.63 (m, 1H), 7.63-7.54 (m, 2H), 7.41 (dd, J = 8.8, 2.1 Hz, 1H), 7.37-7.30 (m, 2H), 6.94 (d, J = 7.9 Hz, 1H), 4.80 (td, J = 8.3, 5.6 Hz, 1H), 2.09-1.94 (m, 2H), 1.93 (t, J = 2.6 Hz, 1H), 1.91-1.70 (m, 7H), 1.51 (t, J = 7.4 Hz, 2H), 1.00 (dd, J = 12.9, 6.1 Hz, 6H). 13C NMR (125 MHz, CDCl3) δ 172.64, 171.84, 135.71, 134.08, 131.04, 129.03, 128.02, 126.74, 125.37, 120.43, 117.39, 83.02, 69.65, 53.48, 41.31, 32.56, 30.42, 28.65, 28.13, 25.35, 23.40, 22.59, 13.59. HRMS (ESI-TOF) calcd for C24H29N4O2 405.2285 (M+H+), found 405.2285

(S)-3-(3-(but-3-yn-1-yl)-3H-diazirin-3-yl)-N-(1-((4-methoxynaphthalen-2-yl)amino)-1-oxopropan-2-yl)propanamide (26)
General Procedure 1. Purified by SiO2 flash chromatography (Hexane/EtOAc, 9:1 ⟶ 4:1 ⟶ 2:1) to afford 26 as a white solid (147 mg, 73%). 1H NMR (500 MHz, CDCl3) δ 8.86 (s, 1H), 8.29-8.14 (m, 1H), 7.79-7.63 (m, 2H), 7.50 (ddd, J = 8.2, 6.7, 1.4 Hz, 1H), 7.44 (ddd, J = 8.2, 6.8, 1.3 Hz, 1H), 7.17 (d, J = 1.8 Hz, 1H), 6.39 (d, J = 7.5 Hz, 1H), 4.83 (p, J = 7.1 Hz, 1H), 4.02 (s, 3H), 2.21-2.03 (m, 5H), 2.02-1.93 (m, 2H), 1.71 (t, J = 7.2 Hz, 2H), 1.61 (d, J = 7.0 Hz, 3H). 13C NMR (125 MHz, CDCl3) δ 172.31, 171.22, 156.39, 136.00, 134.77, 127.54, 124.74, 123.51, 122.22, 109.59, 99.18, 82.97, 69.77, 55.92, 50.34, 32.66, 30.70, 28.76, 28.18, 18.39, 13.62. HRMS (ESI-TOF) calcd for C22H25N4O3 393.1921 (M+H+), found 393.1923.
General Procedure 3

To a solution of N-butanoyl-L-leucine (Effenberger et al., 2015) (1 equiv) in DCM (0.06M relative to acid), added commercially available amine (1.1 equiv), DIPEA (2.2 equiv) EDC-HCl (1.2 equiv) and HOBt (1.2 equiv) were added. Reaction mixtures were stirred at room temperature for 4 hr to overnight when TLC indicated reaction completed. The crude samples were diluted with DCM and washed first with saturated aqueous NH4Cl and saturated aqueous NaHCO3, then dried over anhydrous Na2SO4 and volatiles removed by rotary evaporation. Crude products were purified by PTLC or flash column chromatography.

(S)-2-butyramido-4-methyl-N-((S)-1,2,3,4-tetrahydronaphthalen-1-yl)pentanamide (29)
General Procedure 3. Purified by PTLC (Hexane/EtOAc, 1:1) to afford 29 as an off-white solid (24 mg, 73%). 1H NMR (400 MHz, CDCl3) δ 7.23-7.04 (m, 4H), 6.39 (d, J = 8.8 Hz, 1H), 5.99 (d, J = 8.3 Hz, 1H), 5.16-5.08 (m, 1H), 4.44 (td, J = 8.4, 5.4 Hz, 1H), 2.77 (qd, J = 16.9, 8.7 Hz, 2H), 2.16 (td, J = 7.3, 1.4 Hz, 2H), 2.08-1.93 (m, 1H), 1.91-1.39 (m, 8H), 1.03-0.81 (m, 9H). 13C NMR (125 MHz, CDCl3) δ 173.37, 171.79, 137.83, 136.59, 129.52, 128.83, 127.71, 126.68, 52.03, 48.02, 41.91, 38.87, 30.49, 29.59, 25.28, 23.27, 22.76, 20.46, 19.48, 14.09. HRMS (ESI-TOF) calcd for C20H31N2O2 331.2380(M+H+), found 331.2383

(S)-N-(2-(benzo[d][1,3]dioxol-5-yl)ethyl)-2-butyramido-4-methylpentanamide (30)
General Procedure 3. Purified by SiO2 flash chromatography (Hexane/EtOAc, 3:2) to afford 30 as a white solid (181 mg, 75%). 1H NMR (500 MHz, CDCl3) δ 6.73 (d, J = 7.9 Hz, 1H), 6.69-6.64 (m, 1H), 6.62 (dd, J = 7.9, 1.7 Hz, 1H), 6.45-6.34 (m, 1H), 6.06 (t, J = 7.9 Hz, 1H), 5.92 (s, 2H), 4.39 (td, J = 8.3, 6.1 Hz, 1H), 3.49 (dq, J = 13.5, 6.9 Hz, 1H), 3.38 (dq, J = 13.3, 6.8 Hz, 1H), 2.71 (t, J = 7.1 Hz, 2H), 2.15 (t, J = 7.5 Hz, 2H), 1.70-1.41 (m, 5H), 0.97-0.85 (m, 9H). 13C NMR (125 MHz, CDCl3) δ 173.43, 172.46, 148.18, 146.60, 132.80, 122.02, 109.46, 108.72, 101.29, 51.89, 41.55, 41.20, 38.82, 35.70, 25.18, 23.17, 22.69, 19.44, 14.08. HRMS (ESI-TOF) calcd for C19H29N2O4 349.2122(M+H+), found 349.2124.
General Procedure 4

To commercially available amine (1.0 equiv) in DCM (0.1 M), added DIPEA (1.1 equiv) followed by the slow addition of butanoyl chloride (1.0 equiv). Resulting mixture was allowed to stir at room temperature until amine was fully consumed, as indicated by TLC. The crude mixture was diluted with DCM, washed first with saturated aqueous NH4Cl and saturated aqueous NaHCO3, then dried over anhydrous Na2SO4 and volatiles removed by rotary evaporation. Crude products were purified by PTLC.

(S)-2-butyramido-4-methyl-N-(naphthalen-2-yl)pentanamide (27)
General Procedure 4. Purified by PTLC (DCM/MeOH, 20:1) to afford 27 as a white solid (15 mg, 58%). 1H NMR (400 MHz, CDCl3) δ 9.41 (s, 1H), 8.26-8.09 (m, 1H), 7.69-7.54 (m, 3H), 7.42 (dd, J = 8.8, 2.1 Hz, 1H), 7.38-7.29 (m, J = 7.1, 3.5 Hz, 2H), 6.62 (d, J = 8.0 Hz, 1H), 4.83 (td, J = 8.3, 5.9 Hz, 1H), 2.22 (apparent td, J = 7.3, 2.9 Hz, 2H), 1.92–1.57 (m, 5H), 0.99 (dd, J = 12.4, 6.1 Hz, 6H), 0.90 (t, J = 7.4 Hz, 3H). 13C NMR (125 MHz, CDCl3) δ 174.40, 171.36, 135.78, 134.13, 131.00, 128.96, 128.00, 127.85, 126.69, 125.26, 120.40, 117.15, 53.08, 40.96, 38.78, 25.33, 23.34, 22.67, 19.53, 14.04. HRMS (ESI-TOF) calcd for C20H26N2O2 327.2067 (M+H+), found 327.2069

(S)-N-(1-((4-methoxynaphthalen-2-yl)amino)-1-oxopropan-2-yl)butyramide (28)
General Procedure 4. Purified by PTLC (DCM/MeOH, 9:1) to afford 28 as a colorless solid (22.7 mg, 68%).1H NMR (500 MHz, CDCl3) δ 9.36 (s, 1H), 8.12 (dd, J = 8.2, 1.4 Hz, 1H), 7.69-7.64 (m, 1H), 7.62 (d, J = 8.1 Hz, 1H), 7.40 (ddd, J = 8.2, 6.7, 1.4 Hz, 1H), 7.34 (ddd, J = 8.2, 6.8, 1.3 Hz, 1H), 7.10 (d, J = 1.8 Hz, 1H), 6.56 (d, J = 7.5 Hz, 1H), 4.91 (p, J = 7.1 Hz, 1H), 3.91 (s, 3H), 2.27 (apparent td, J = 7.4, 3.1 Hz, 2H), 1.78-1.68 (m, 2H), 1.55 (d, J = 6.9 Hz, 3H), 0.96 (t, J = 7.4 Hz, 3H). 13C NMR (125 MHz, CDCl3) δ 173.23, 170.49, 155.47, 135.40, 133.97, 126.67, 123.75, 122.56, 121.34, 108.54, 98.25, 55.04, 49.29, 38.06, 18.74, 17.78, 13.23. HRMS (ESI-TOF) calcd for C18H23N2O3 315.1703 (M+H+), found 315.1703

1-(4-phenylpiperidin-1-yl)butan-1-one (49)
General Procedure 4. Purified by SiO2 flash chromatography (Hexanes/EtOAc, 10:1 ⟶ 3:1) to afford 49 as a white solid (110 mg, 77%). 1H NMR (500 MHz, CDCl3) δ 7.31 (t, J = 7.6 Hz, 2H), 7.24 –7.16 (m, 3H), 4.81 (ddd, J = 13.5, 4.2, 2.2 Hz, 1H), 3.99 (ddt, J = 13.8, 4.2, 2.2 Hz, 1H), 3.12 (td, J = 13.1, 2.6 Hz, 1H), 2.73 (tt, J = 12.2, 3.7 Hz, 1H), 2.68-2.56 (m, 1H), 2.44-2.25 (m, 2H), 2.00-1.83 (m, 2H), 1.75-1.52 (m, 4H), 0.99 (t, J = 7.4 Hz, 3H). HRMS (ESI-TOF) calcd for C13H14NO3 232.0968 [M+H+], found 232.0967

N-(2-oxo-2H-chromen-6-yl)butyramide (50)
General Procedure 4. Purified by SiO2 flash chromatography (Hexanes/EtOAc, 10:1 ⟶ 3:1) to afford 50 as a light yellow solid (116 mg, 81%). 1H NMR (400 MHz, CDCl3) δ 8.07 (d, J = 2.5 Hz, 1H), 7.69 (d, J = 9.5 Hz, 1H), 7.52 (brs, 1H), 7.42 (dd, J = 8.9, 2.6 Hz, 1H), 7.28 (d, J = 2.4 Hz, 1H), 6.44 (d, J = 9.6 Hz, 1H), 2.39 (t, J = 7.4 Hz, 2H), 1.79 (h, J = 7.4 Hz, 2H), 1.03 (t, J = 7.4 Hz, 3H). HRMS (ESI-TOF) calcd for C15H22NO 232.1696 [M+H+], found 232.1696

1-(4-(2-Methoxyphenyl)piperazin-1-yl)-2-phenylethan-1-one (22)
To a mixture of 1-(2-methoxyphenyl)piperazine (30 mg, 0.156 mmol) in anhydrous CH2Cl2 (1.5 mL) and pyridine (0.5 mL) was added phenylacetylchloride (23 mg, 0.172 mmol, 1.1 equiv). The reaction mixture was stirred at room temperature for 12 hr before removing the solvent under reduced pressure. The remaining residue was purified by PTLC (Hexanes/EtOAc, 2/1) providing the title compound 22 as a colorless oil (46 mg, 96%). 1H NMR (600 MHz, CDCl3) δ 7.33 (t, J = 7.5 Hz, 2H), 7.29 – 7.22 (m, 3H), 7.02 (td, J = 7.7, 1.5 Hz, 1H), 6.93 – 6.81 (m, 3H), 3.85 – 3.83 (m, 5H), 3.79 (s, 2H), 3.64 – 3.59 (m, 2H), 3.00 (t, J = 5.1 Hz, 2H), 2.85 (t, J = 5.0 Hz, 2H). 13C NMR (151 MHz, CDCl3) δ 40.66, 41.58, 46.00, 50.02, 50.37, 54.99, 110.86, 117.95, 120.58, 123.08, 126.39, 128.16, 128.33, 134.67, 140.20, 151.78, 169.08. HRMS (ESI-TOF) calcd for C19H23N2O2 311.1754 [M+H+], found 311.1753

1-(Benzylsulfonyl)-4-(2-methoxyphenyl)piperidine (23)
To a mixture of 4-(2-methoxyphenyl)piperidine (50 mg, 0.26 mmol) and N,N-diisopropylethylamine (DIPEA, 0.100 mL, 0.58 mmol) in anhydrous THF (3.0 mL) was added benzylsulfonyl chloride (55 mg, 0.28 mmol, 1.1 equiv.) under N2. The reaction mixture was stirred at 50°C for 12 hr. The reaction mixture was poured into a separatory funnel with brine (10 mL) and extracted with EtOAc (2 × 10 mL). The combined organic layers were then dried over anhydrous Na2SO4 and concentrated under reduced pressure. The remaining residue was purified by SiO2 flash chromatography (Hexanes/EtOAc, 5/1) providing the title compound 23 as a slightly beige powder (50 mg, 56%). 1H NMR (600 MHz, CDCl3) δ 7.46 – 7.35 (m, 5H), 7.19 (ddd, J = 8.3, 7.4, 1.7 Hz, 1H), 7.10 (dd, J = 7.6, 1.7 Hz, 1H), 6.93 (td, J = 7.5, 1.1 Hz, 1H), 6.85 (dd, J = 8.2, 1.1 Hz, 1H), 4.24 (s, 2H), 3.83 – 3.75 (m, 5H), 2.96 (tt, J = 12.1, 3.5 Hz, 1H), 2.72 (td, J = 12.4, 2.5 Hz, 2H), 1.80 – 1.73 (m, 2H), 1.64 (qd, J = 12.6, 4.2 Hz, 2H). 13C NMR (151 MHz, CDCl3) δ 169.48, 152.18, 140.60, 135.07, 128.73, 128.56, 126.79, 123.48, 120.98, 118.35, 111.26, 55.39, 50.77, 50.42, 46.40, 41.98, 41.06. HRMS (ESI-TOF) calcd for C19H24NO3S 346.1471 (M+H+), found 346.1472.

N-(2-(4-(2-methoxyphenyl)piperidin-1-yl)-2-oxoethyl)acetamide (51)
4-(2-methoxyphenyl)piperidine (50 mg, 0.26 mmol), acetylglycine (46 mg, 0.39 mmol, 1.5 equiv.) and N,N-diisopropylethylamine (DIPEA, 0.137 mL, 0.58 mmol, 3.0 equiv.) in anhydrous DMF (1.0 mL) were added EDC (75 mg, 0.39 mmol, 1.5 equiv.) and HOAt (53 mg, 0.39 mmol, 1.5 equiv.). The reaction mixture was stirred at room temperature for ~12 hr before removing the solvent under reduced pressure. The remaining residue was purified by PTLC (CH2Cl2/MeOH, 9/1) providing the title compound 51 as a colorless oil (40 mg, 53%). 1H NMR (600 MHz, CDCl3) δ 7.21 (ddd, J = 8.2, 7.4, 1.7 Hz, 1H), 7.10 (dd, J = 7.6, 1.8 Hz, 1H), 6.93 (td, J = 7.5, 1.1 Hz, 1H), 6.87 (dd, J = 8.2, 1.1 Hz, 1H), 6.67 (brs, 1H), 4.77 – 4.71 (m, 1H), 4.16 – 4.09 (m, 1H), 4.05 (dd, J = 17.3, 3.8 Hz, 1H), 3.83-3.81 (m, 4H), 3.24 – 3.12 (m, 2H), 2.75 (td, J = 12.9, 2.8 Hz, 1H), 2.05 (s, 3H), 1.94 – 1.85 (m, 2H), 1.68 – 1.52 (m, 2H). 13C NMR (151 MHz, CDCl3) δ 23.07, 31.26, 32.12, 35.43, 41.40, 43.13, 45.30, 55.28, 110.42, 120.70, 126.38, 127.40, 132.74, 156.66, 166.03, 170.09. HRMS (ESI-TOF) calcd for C16H23N2O3 291.1703 (M+H+), found 291.1704.

1-(4-(2-Methoxyphenyl)piperidin-1-yl)-2-(piperidin-1-yl)ethan-1-one (52)
To a mixture of 4-(2-methoxyphenyl)piperidine (350 mg, 1.83 mmol) and triethylamine (0.643 mL, 4.57 mmol, 2.5 equiv.) in anhydrous CH2Cl2 (3.5 mL) was slowly added chloroacetyl chloride (0.175 mL, 2.20 mmol, 1.2 equiv.) under N2 at 0°C. The reaction mixture was stirred at room temperature for 1 hr and diluted with EtOAc (10 mL). The mixture was washed with 1N aqueous HCl (1 × 10 mL) and brine. The organic layer was then dried over anhydrous Na2SO4 and concentrated under reduced pressure to afford a crude compound as a dark brown oil which was used to next reaction without further purification.
To a mixture of the oil (100 mg, 0.37 mmol) and triethylamine (0.156 mL, 1.12 mmol, 3.0 equiv.) in CH3CN (1 mL) was added piperidine (0.110 mL, 1.12 mmol, 3.0 equiv.) under N2. The reaction mixture was stirred at room temperature for 1 hr and then quenched with H2O (1 mL). The product was extracted with EtOAc (2 × 10 mL). The combined organic layers were then dried over anhydrous Na2SO4 and concentrated under reduced pressure. The remaining residue was purified by SiO2 flash chromatography (Hexanes/EtOAc, 3/1, 3% Et3N) providing the title compound 52 as a pale yellow oil (84 mg, 71% in 2 steps). 1H NMR (600 MHz, CDCl3) δ 7.20 (ddd, J = 8.2, 7.4, 1.7 Hz, 1H), 7.12 (dd, J = 7.6, 1.7 Hz, 1H), 6.93 (td, J = 7.5, 1.2 Hz, 1H), 6.87 (dd, J = 8.2, 1.1 Hz, 1H), 4.77 – 4.70 (m, 1H), 4.32 – 4.25 (m, 1H), 3.83 (s, 3H), 3.25 (d, J = 13.3 Hz, 1H), 3.22 – 3.14 (m, 1H), 3.12 – 3.04 (m, 3H), 2.65 (td, J = 12.9, 2.7 Hz, 1H), 2.47 – 2.41 (m, 4H), 1.87 – 1.83 (m, 1H), 1.66 (qd, J = 12.6, 4.1 Hz, 1H), 1.61 – 1.53 (m, 5H), 1.45 – 1.41 (m, 2H). 13C NMR (151 MHz, CDCl3) δ 24.01, 24.04, 26.03, 31.72, 32.59, 35.61, 42.84, 46.71, 54.32, 54.42, 55.26, 62.61, 109.95, 110.38, 120.66, 126.47, 126.49, 127.15, 133.53, 156.74, 168.41. HRMS (ESI-TOF) calcd for C19H29N2O2 317.2223 (M+H+), found 317.2226.

1-(4-(2-Methoxyphenyl)piperidin-1-yl)-2-morpholinoethan-1-one (53)
4-(2-methoxyphenyl)piperidine (30 mg, 0.16 mmol), morpholin-4-ylacetic acid (27 mg, 0.19 mmol, 1.2 equiv.) and DIPEA (0.084 mL, 0.48 mmol, 3.0 equiv.) in anhydrous DMF (1.0 mL) were added EDC (45 mg, 0.23 mmol, 1.5 equiv.) and HOAt (32 mg, 0.23 mmol, 1.5 equiv.). The reaction mixture was stirred at room temperature for 2 days. H2O (1 mL) was added to the reaction mixture and product was extracted with EtOAc (2 × 1 mL). The combined organic layers were concentrated under reduced pressure. The remaining residue was purified by PTLC (EtOAc/MeOH, 5/1) providing the title compound 53 as a colorless oil (35 mg, 70%). 1H NMR (400 MHz, CDCl3) δ 7.21 (td, J = 7.8, 1.7 Hz, 1H), 7.11 (dd, J = 7.6, 1.7 Hz, 1H), 6.98 – 6.84 (m, 2H), 4.74 (d, J = 12.9 Hz, 1H), 4.18 (d, J = 13.4 Hz, 1H), 3.83 (s, 3H), 3.74 (t, J = 4.7 Hz, 4H), 3.28 (d, J = 13.5 Hz, 1H), 3.24 – 3.07 (m, 3H), 2.72 – 2.61 (m, 1H), 2.60 – 2.47 (m, 4H), 1.88 (t, J = 14.4 Hz, 2H), 1.69 – 1.59 (m, 2H). HRMS (ESI-TOF) calcd for C18H27N2O3 319.2016 (M+H+), found 319.2017.

1-(2-(4-(2-Methoxyphenyl)piperidin-1-yl)-2-oxoethyl)pyridin-2(1H)-one (54)
4-(2-methoxyphenyl)piperidine (50 mg, 0.26 mmol), (2-oxo-2H-pyridin-1-yl)-acetic acid (48 mg, 0.31 mmol, 1.2 equiv.) and triethylamine (0.054 mL, 0.39 mmol, 1.5 equiv.) in anhydrous DMF (1.0 mL) were added EDC (76 mg, 0.39 mmol, 1.5 equiv.) and HOAt (53 mg, 0.39 mmol, 1.5 equiv.). The reaction mixture was stirred at room temperature for ~12 hr before removing the solvent under reduced pressure. The remaining residue was purified by PTLC (EtOAc/MeOH, 6/1) providing the title compound 54 as a colorless oil (39 mg, 46%). 1H NMR (600 MHz, CDCl3) δ 7.39 – 7.30 (m, 2H), 7.20 (ddd, J = 8.2, 7.4, 1.7 Hz, 1H), 7.12 (dd, J = 7.5, 1.7 Hz, 1H), 6.93 (td, J = 7.5, 1.1 Hz, 1H), 6.87 (dd, J = 8.2, 1.1 Hz, 1H), 6.58 (ddd, J = 9.2, 1.4, 0.7 Hz, 1H), 6.21 (td, J = 6.7, 1.4 Hz, 1H), 4.86 (d, J = 15.2 Hz, 1H), 4.80 – 4.69 (m, 2H), 4.15 – 4.04 (m, 1H), 3.83 (s, 3H), 3.31 – 3.16 (m, 2H), 2.75 (td, J = 13.0, 2.9 Hz, 1H), 1.97 – 1.90 (m, 1H), 1.90 – 1.83 (m, 1H), 1.72 – 1.58 (m, 2H). 13C NMR (151 MHz, CDCl3) δ 30.90, 31.84, 34.98, 42.98, 45.82, 48.40, 54.87, 105.52, 109.56, 109.96, 120.22, 120.29, 126.06, 126.91, 132.51, 138.06, 139.59, 156.27, 161.96, 164.46. HRMS (ESI-TOF) calcd for C19H23N2O3 327.1703 (M+H+), found 327.1705.

1-(4-(2-Methoxyphenyl)piperidin-1-yl)-2-phenylethan-1-on (55)
To a mixture of 4-(2-methoxyphenyl)piperidine (30 mg, 0.16 mmol) and triethylamine (0.073 mL, 0.24 mmol, 1.5 equiv.) in anhydrous CH2Cl2 (1.0 mL) was added phenylacetyl chloride (26 mg, 0.17 mmol, 1.1 equiv.) under N2 at 0°C. The reaction mixture was stirred at room temperature for 1 hr before removing the solvent under reduced pressure. The remaining residue was purified by PTLC (Hexanes/EtOAc, 2/1) providing the title compound 55 as a white solid (15 mg, 31%). 1H NMR (500 MHz, CDCl3) δ 7.36 – 7.27 (m, 3H), 7.27 – 7.14 (m, 3H), 7.03 (dd, J = 7.5, 1.7 Hz, 1H), 6.94 – 6.82 (m, 2H), 4.81 (d, J = 13.1 Hz, 1H), 3.97 (d, J = 13.4 Hz, 1H), 3.80 (s, 3H), 3.78 (s, 2H), 3.17 – 3.04 (m, 2H), 2.67 (td, J = 12.9, 2.8 Hz, 1H), 1.83 (d, J = 13.5 Hz, 1H), 1.73 (d, J = 13.3 Hz, 1H), 1.59 (td, J = 12.7, 4.3 Hz, 1H), 1.31 (qd, J = 12.6, 4.1 Hz, 1H). HRMS (ESI-TOF) calcd for C20H24NO2 310.1801 (M+H+), found 310.1801.

4-(2-Methoxyphenyl)-N-phenylpiperidine-1-carboxamide (56)
To a solution of 4-(2-methoxyphenyl)piperidine (50 mg, 0.26 mmol) in anhydrous DMF (1.0 mL) was added sodium hydride (in 60% oil, 12.5 mg, 0.31 mmol, 1.2 equiv.) under N2 at 0°C. The mixture was stirred at 0°C for 15 min. Phenylisocyanate (37 mg, 0.31 mmol, 1.2 equiv.) in anhydrous DMF (0.5 mL) was added to the mixture. The reaction was then allowed to warm to room temperature. After stirring at room temperature for 1 hr, the reaction was quenched with saturated aqueous NH4Cl and the product was extracted with EtOAc (2 × 10 mL). The combined organic layers were then dried over anhydrous Na2SO4 and concentrated under reduced pressure. The remaining residue was purified by PTLC (Hexanes/EtOAc, 1/1) providing the title compound 56 as an off-white powder (71 mg, 89%). 1H NMR (600 MHz, CDCl3) δ 7.41 – 7.36 (m, 2H), 7.36 – 7.25 (m, 2H), 7.24 – 7.13 (m, 2H), 7.03 (tt, J = 7.4, 1.2 Hz, 1H), 6.94 (td, J = 7.5, 1.1 Hz, 1H), 6.88 (dd, J = 8.1, 1.1 Hz, 1H), 6.39 (brs, 1H), 4.24 – 4.18 (m, 2H), 3.84 (s, 3H), 3.17 (tt, J = 12.1, 3.5 Hz, 1H), 3.03 (td, J = 13.0, 2.6 Hz, 2H), 1.92 – 1.86 (m, 2H), 1.76 – 1.66 (m, 2H). 13C NMR (151 MHz, CDCl3) δ 31.26, 34.92, 44.81, 54.85, 76.31, 76.81, 76.91, 76.99, 109.94, 119.33, 119.36, 120.24, 120.25, 122.45, 122.49, 126.06, 126.79, 128.40, 128.43, 154.45, 156.27. HRMS (ESI-TOF) calcd for C19H23N2O2 311.1754 (M+H+), found 311.1753.

2-Phenyl-1-(4-(2-(trifluoromethyl)phenyl)piperidin-1-yl)ethan-1-one (57)
To a mixture of 4-(2-(trifluoromethyl)phenyl)piperidine hydrochloride (40 mg, 0.15 mmol) in anhydrous CH2Cl2 (1.5 mL) and pyridine (0.5 mL) was added phenylacetylchloride (26 mg, 0.17 mmol, 1.1 equiv.) under N2 at 0°C. The reaction mixture was stirred at room temperature for 12 hr before removing the solvent under reduced pressure. The remaining residue was purified by PTLC (Hexanes/EtOAc, 2/1) providing the title compound 57 as a colorless oil (40 mg, 77%). 1H NMR (600 MHz, CDCl3) δ 7.61 (dd, J = 7.9, 1.2 Hz, 1H), 7.51 – 7.45 (m, 1H), 7.38 – 7.22 (m, 7H), 4.88 – 4.81 (m, 1H), 4.02 – 3.96 (m, 1H), 3.84 – 3.75 (m, 2H), 3.15 – 3.04 (m, 2H), 2.65 (td, J = 13.0, 2.8 Hz, 1H), 1.82 (d, J = 13.3 Hz, 1H), 1.69 (d, J = 13.2 Hz, 1H), 1.63 (qd, J = 12.6, 4.2 Hz, 1H), 1.31 (qd, J = 12.6, 4.1 Hz, 1H). 13C NMR (151 MHz, CDCl3) δ 32.46, 33.25, 37.85, 40.91, 42.24, 46.50, 125.05, 125.42, 125.46, 125.91, 126.40, 127.37, 127.55, 128.21, 128.34, 131.65, 134.85, 143.64, 168.99. HRMS (ESI-TOF) calcd for C20H21F3NO 348.1570 (M+H+), found 348.1572.

1-(4-(3-Methoxyphenyl)piperidin-1-yl)-2-phenylethan-1-one (58)
To a mixture of 4-(2-(trifluoromethyl)phenyl)piperidine hydrochloride (40 mg, 0.15 mmol) in anhydrous CH2Cl2 (1.5 mL) and pyridine (0.5 mL) was added phenylacetylchloride (26 mg, 0.17 mmol, 1.1 equiv.) under N2 at 0°C. The reaction mixture was stirred at room temperature for 12 hr before removing the solvent under reduced pressure. The remaining residue was purified by PTLC (Hexanes/EtOAc, 2/1) providing the title compound 58 as a colorless oil (40 mg, 44%). 1H NMR (500 MHz, CDCl3) δ 7.37 – 7.28 (m, 3H), 7.28 – 7.17 (m, 3H), 6.78 – 6.69 (m, 2H), 6.67 – 6.65 (m, 1H), 4.81 (d, J = 13.3 Hz, 1H), 3.98 (d, J = 13.7 Hz, 1H), 3.83 – 3.73 (m, 4H), 3.10 – 3.01 (m, 1H), 2.70 – 2.59 (m, 2H), 1.87 (d, J = 13.5 Hz, 1H), 1.74 (d, J = 14.7 Hz, 1H), 1.65 – 1.56 (m, 1H), 1.38 – 1.23 (m, 2H). HRMS (ESI-TOF) calcd for C20H24NO2 310.1801 (M+H+), found 310.1801.

General procedure 5
To a mixture of 1-phenylacetyl-piperazin hydrochloride (30 mg, 0.13 mmol), phenylboronic acid (2.0 equiv.) and triethylamine (0.092 mL, 0.66 mmol, 5.0 equiv.) in ClCH2CH2Cl (1.0 mL) was added Cu(OAc)2 (48 mg, 0.17 mmol, 2.0 equiv.). The reaction mixture was stirred at 50°C for 12 hr before removing the solvent under reduced pressure. The remaining residue was purified by PTLC (Hexanes/EtOAc, 1/1) providing the title compound.

2-phenyl-1-(4-phenylpiperazin-1-yl)ethan-1-one (59)
General procedure 5. (10 mg, colorless oil, 27%): 1H NMR (500 MHz, CDCl3) δ 7.36 – 7.30 (m, 3H), 7.30 – 7.21 (m, 4H), 6.92 – 6.85 (m, 3H), 3.84 – 3.77 (m, 4H), 3.63 – 3.57 (m, 2H), 3.17 – 3.11 (m, 2H), 2.99 – 2.95 (m, 2H). HRMS (ESI-TOF) calcd for C18H21N2O 281.1648 (M+H+), found 281.1649.

1-(4-(4-methoxyphenyl)piperazin-1-yl)-2-phenylethan-1-one (60)
General procedure 5. (7.2 mg, colorless oil, 18%): 1H NMR (500 MHz, CDCl3) δ 7.36 – 7.29 (m, 3H), 7.29 – 7.25 (m, 4H), 6.88 – 6.79 (m, 2H), 3.83 – 3.74 (m, 7H), 3.62 – 3.56 (m, 2H), 3.01 (t, J = 5.2 Hz, 2H), 2.87 – 2.83 (m, 2H). HRMS (ESI-TOF) calcd for C19H23N2O2 311.1754 (M+H+), found 311.1755.

1-(4-(4-methoxyphenyl)piperazin-1-yl)-2-phenylethan-1-one (61)
General procedure 5. (1.6 mg, white solid, 3.0%): 1H NMR (500 MHz, CDCl3) δ 7.38 – 7.24 (m, 6H), 7.21 – 7.17 (m, 2H), 3.86 – 3.78 (m, 4H), 3.63 (t, J = 5.2 Hz, 2H), 3.26 (t, J = 5.3 Hz, 2H), 3.08 (t, J = 5.1 Hz, 2H). HRMS (ESI-TOF) calcd for C20H19F6N2O 417.1396 (M+H+), found 417.1397

1-(4-(2-phenoxyphenyl)piperazin-1-yl)-2-phenylethan-1-one (62)
General procedure 5. (3.3 mg, colorless oil, 6.8%): 1H NMR (500 MHz, CDCl3) δ 7.34 – 7.20 (m, 6H), 7.13 – 6.85 (m, 8H), 3.72 (s, 2H), 3.60 (t, J = 5.1 Hz, 2H), 3.40 – 3.34 (m, 2H) 3.02 (t, J = 5.1 Hz, 2H), 2.87 (t, J = 5.0 Hz, 2H). HRMS (ESI) calcd for C24H25N2O2 373.191 (M+H+), found 373.1909.
QUANTIFICATION AND STATISTICAL ANALYSIS
All data fitting and statistical analysis performed using GraphPad Prism version 6.00 for Windows, GraphPad Software, La Jolla California USA, www.graphpad.com. Statistical values including the exact n and stasticial significance are also reported in the Figure Legends. Probe binding blockade and PTGR2 inhibition curves are plotted as mean ± SD (n = 3 or 4 per group) for a representative biological replicate using a variable slope (four parameter) non-linear fit. Gene expression data are presented as mean ± SD (n = 3 per group). HSC5 metabolite data are shown as mean ± SD (n = 3 per group). Statistical significance was defined as p < 0.05 and determined by 2-tailed Student’s t tests, or two-way ANOVA with Bonferroni’s post-tests.
DATA AND SOFTWARE AVAILABILITY
Data Resources
The RNA-seq data reported in this paper has been deposited in the NCBI under the ID code GEO: GSE90731.
Software
All custom scripts used in this paper have been deposited to GitHub (https://github.com/Chymichead/FBDDinCell).
Supplementary Material
Highlights.
Chemical proteomics identify numerous fragment-protein interactions in cells
Interactions can be advanced into selective ligands that modulate protein function
Fragment-based probes facilitate target identification in phenotypic screening
Fragment-based ligands promote adipogenesis by stimulating PGRMC2 function
Acknowledgments
We thank L. Thompson, J. Shi, A. Roy, D. Vytla, S. Bhaskaran, K. Srinivasarao, R. Velayuthaperumal, K. Gurubaran, and M. Asiff for their contributions to the synthesis and purification of the FFF probe library, and M.M. Dix, D.J. Hermanson, K.M. Lum, S. Forli, U. Garaigorta, and S. Lee for additional technical assistance. C.G.P. was supported by a Postdoctoral Fellowship PF-14-100-01-CDD from the American Cancer Society. A.G. was supported by fellowship 14POST18200019 from the American Heart Association. This work was supported by NIH (DK099810, CA132630, 1S10OD16357).
Footnotes
SUPPLEMENTAL INFORMATION
Supplemental Information includes seven figures, seven tables, and one data file and can be found with this article online at http://dx.doi.org/10.1016/j.cell.2016.12.029.
AUTHOR CONTRIBUTIONS
C.G.P., A.G., E.S., and B.F.C. designed experiments, interpreted results, and wrote the manuscript. C.G.P., Y.J.W., and K.S. synthesized fragment probes and competitors. C.G.P., B.E.C., and C.M.J. performed gel and MS-based experiments. C.G.P., B.E.C., and Y.J.W. analyzed MS data. A.G. performed adipocyte screen and characterization experiments. C.G.P. and A.G. performed PGRMC2 target identification studies. C.G.P., A.G., K.S., and A.S.K. performed biological experiments for PTGR2 and SLC25A20. C.C., M.L., S.R.J., and C.G.P. assisted with synthesis and characterization of FFF probe library for phenotypic screening. A.G. and I.N. performed RNA-seq analysis.
References
- Backus KM, Correia BE, Lum KM, Forli S, Horning BD, González-Páez GE, Chatterjee S, Lanning BR, Teijaro JR, Olson AJ, et al. Proteome-wide covalent ligand discovery in native biological systems. Nature. 2016;534:570–574. doi: 10.1038/nature18002. [DOI] [PMC free article] [PubMed] [Google Scholar]
- Bembenek SD, Tounge BA, Reynolds CH. Ligand efficiency and fragment-based drug discovery. Drug Discov. Today. 2009;14:278–283. doi: 10.1016/j.drudis.2008.11.007. [DOI] [PubMed] [Google Scholar]
- Brückl T, Baxter RD, Ishihara Y, Baran PS. Innate and guided C-H functionalization logic. Acc Chem Res. 2012;45:826–839. doi: 10.1021/ar200194b. [DOI] [PMC free article] [PubMed] [Google Scholar]
- Cahill MA. Progesterone receptor membrane component 1: An integrative review. J Steroid Biochem Mol Biol. 2007;105:16–36. doi: 10.1016/j.jsbmb.2007.02.002. [DOI] [PubMed] [Google Scholar]
- Chen JJ, London IM. Hemin enhances the differentiation of mouse 3T3 cells to adipocytes. Cell. 1981;26:117–122. doi: 10.1016/0092-8674(81)90039-8. [DOI] [PubMed] [Google Scholar]
- Chou WL, Chuang LM, Chou CC, Wang AH, Lawson JA, FitzGerald GA, Chang ZF. Identification of a novel prostaglandin reductase reveals the involvement of prostaglandin E2 catabolism in regulation of peroxisome proliferator-activated receptor gamma activation. J Biol Chem. 2007;282:18162–18172. doi: 10.1074/jbc.M702289200. [DOI] [PubMed] [Google Scholar]
- Cisar JS, Cravatt BF. Fully functionalized small-molecule probes for integrated phenotypic screening and target identification. J Am Chem Soc. 2012;134:10385–10388. doi: 10.1021/ja304213w. [DOI] [PMC free article] [PubMed] [Google Scholar]
- Dai HX, Stepan AF, Plummer MS, Zhang YH, Yu JQ. Divergent C-H functionalizations directed by sulfonamide pharmacophores: Late-stage diversification as a tool for drug discovery. J Am Chem Soc. 2011;133:7222–7228. doi: 10.1021/ja201708f. [DOI] [PubMed] [Google Scholar]
- Dominguez E, Galmozzi A, Chang JW, Hsu KL, Pawlak J, Li W, Godio C, Thomas J, Partida D, Niessen S, et al. Integrated phenotypic and activity-based profiling links Ces3 to obesity and diabetes. Nat Chem Biol. 2014;10:113–121. doi: 10.1038/nchembio.1429. [DOI] [PMC free article] [PubMed] [Google Scholar]
- Edfeldt FN, Folmer RH, Breeze AL. Fragment screening to predict druggability (ligandability) and lead discovery success. Drug Discov Today. 2011;16:284–287. doi: 10.1016/j.drudis.2011.02.002. [DOI] [PubMed] [Google Scholar]
- Edwards AM, Bountra C, Kerr DJ, Willson TM. Open access chemical and clinical probes to support drug discovery. Nat Chem Biol. 2009;5:436–440. doi: 10.1038/nchembio0709-436. [DOI] [PubMed] [Google Scholar]
- Effenberger KA, James RC, Urabe VK, Dickey BJ, Linington RG, Jurica MS. The natural product N-palmitoyl-l-leucine selectively inhibits late assembly of human spliceosomes. J Biol Chem. 2015;290:27524–27531. doi: 10.1074/jbc.M115.673210. [DOI] [PMC free article] [PubMed] [Google Scholar]
- Geiger T, Wehner A, Schaab C, Cox J, Mann M. Comparative proteomic analysis of eleven common cell lines reveals ubiquitous but varying expression of most proteins. Mol Cell Proteomics. 2012;11:M111014050. doi: 10.1074/mcp.M111.014050. [DOI] [PMC free article] [PubMed] [Google Scholar]
- Gerdes D, Wehling M, Leube B, Falkenstein E. Cloning and tissue expression of two putative steroid membrane receptors. Biol Chem. 1998;379:907–911. doi: 10.1515/bchm.1998.379.7.907. [DOI] [PubMed] [Google Scholar]
- Grant D, Yin L, Collins JL, Parks DJ, Orband-Miller LA, Wisely GB, Joshi S, Lazar MA, Willson TM, Zuercher WJ. GSK4112, a small molecule chemical probe for the cell biology of the nuclear heme receptor Rev-erbα. ACS Chem Biol. 2010;5:925–932. doi: 10.1021/cb100141y. [DOI] [PubMed] [Google Scholar]
- Guce AI, Clark NE, Rogich JJ, Garman SC. The molecular basis of pharmacological chaperoning in human α-galactosidase. Chem Biol. 2011;18:1521–1526. doi: 10.1016/j.chembiol.2011.10.012. [DOI] [PMC free article] [PubMed] [Google Scholar]
- Hajduk PJ, Greer J. A decade of fragment-based drug design: Strategic advances and lessons learned. Nat Rev Drug Discov. 2007;6:211–219. doi: 10.1038/nrd2220. [DOI] [PubMed] [Google Scholar]
- Hopkins AL, Groom CR. The druggable genome. Nat Rev Drug Discov. 2002;1:727–730. doi: 10.1038/nrd892. [DOI] [PubMed] [Google Scholar]
- Indiveri C, Iacobazzi V, Tonazzi A, Giangregorio N, Infantino V, Convertini P, Console L, Palmieri F. The mitochondrial carnitine/acylcarnitine carrier: Function, structure and physiopathology. Mol Aspects Med. 2011;32:223–233. doi: 10.1016/j.mam.2011.10.008. [DOI] [PubMed] [Google Scholar]
- Kabe Y, Nakane T, Koike I, Yamamoto T, Sugiura Y, Harada E, Sugase K, Shimamura T, Ohmura M, Muraoka K, et al. Haem-dependent dimerization of PGRMC1/Sigma-2 receptor facilitates cancer proliferation and chemoresistance. Nat Commun. 2016;7:11030. doi: 10.1038/ncomms11030. [DOI] [PMC free article] [PubMed] [Google Scholar]
- Kambe T, Correia BE, Niphakis MJ, Cravatt BF. Mapping the protein interaction landscape for fully functionalized small-molecule probes in human cells. J Am Chem Soc. 2014;136:10777–10782. doi: 10.1021/ja505517t. [DOI] [PMC free article] [PubMed] [Google Scholar]
- Kim YG, Lou AC, Saghatelian A. A metabolomics strategy for detecting protein-metabolite interactions to identify natural nuclear receptor ligands. Mol Biosyst. 2011;7:1046–1049. doi: 10.1039/c0mb00324g. [DOI] [PubMed] [Google Scholar]
- Kojetin D, Wang Y, Kamenecka TM, Burris TP. Identification of SR8278, a synthetic antagonist of the nuclear heme receptor REV-ERB. ACS Chem Biol. 2011;6:131–134. doi: 10.1021/cb1002575. [DOI] [PMC free article] [PubMed] [Google Scholar]
- Kolb P, Ferreira RS, Irwin JJ, Shoichet BK. Docking and chemoinformatic screens for new ligands and targets. Curr Opin Biotechnol. 2009;20:429–436. doi: 10.1016/j.copbio.2009.08.003. [DOI] [PMC free article] [PubMed] [Google Scholar]
- Kozakov D, Hall DR, Jehle S, Luo L, Ochiana SO, Jones EV, Pollastri M, Allen KN, Whitty A, Vajda S. Ligand deconstruction: Why some fragment binding positions are conserved and others are not. Proc Natl Acad Sci USA. 2015;112:E2585–E2594. doi: 10.1073/pnas.1501567112. [DOI] [PMC free article] [PubMed] [Google Scholar]
- Le Guilloux V, Schmidtke P, Tuffery P. Fpocket: An open source platform for ligand pocket detection. BMC Bioinformatics. 2009;10:168. doi: 10.1186/1471-2105-10-168. [DOI] [PMC free article] [PubMed] [Google Scholar]
- Lee J, Bogyo M. Target deconvolution techniques in modern phenotypic profiling. Curr Opin Chem Biol. 2013;17:118–126. doi: 10.1016/j.cbpa.2012.12.022. [DOI] [PMC free article] [PubMed] [Google Scholar]
- Li Z, Hao P, Li L, Tan CYJ, Cheng X, Chen GYJ, Sze SK, Shen HM, Yao SQ. Design and synthesis of minimalist terminal alkyne-containing diazirine photo-crosslinkers and their incorporation into kinase inhibitors for cell- and tissue-based proteome profiling. Angew Chem Int Ed Engl. 2013;52:8551–8556. doi: 10.1002/anie.201300683. [DOI] [PubMed] [Google Scholar]
- Martinez Molina D, Jafari R, Ignatushchenko M, Seki T, Larsson EA, Dan C, Sreekumar L, Cao Y, Nordlund P. Monitoring drug target engagement in cells and tissues using the cellular thermal shift assay. Science. 2013;341:84–87. doi: 10.1126/science.1233606. [DOI] [PubMed] [Google Scholar]
- Mifsud W, Bateman A. Membrane-bound progesterone receptors contain a cytochrome b5-like ligand-binding domain. Genome Biol. 2002;3 doi: 10.1186/gb-2002-3-12-research0068. RESEARCH0068. [DOI] [PMC free article] [PubMed] [Google Scholar]
- Molzan M, Weyand M, Rose R, Ottmann C. Structural insights of the MLF1/14-3-3 interaction. FEBS J. 2012;279:563–571. doi: 10.1111/j.1742-4658.2011.08445.x. [DOI] [PubMed] [Google Scholar]
- Moreno-Navarrete JM, Ortega F, Moreno M, Ricart W, Fernández-Real JM. Fine-tuned iron availability is essential to achieve optimal adipocyte differentiation and mitochondrial biogenesis. Diabetologia. 2014;57:1957–1967. doi: 10.1007/s00125-014-3298-5. [DOI] [PubMed] [Google Scholar]
- Niphakis MJ, Lum KM, Cognetta AB, 3rd, Correia BE, Ichu TA, Olucha J, Brown SJ, Kundu S, Piscitelli F, Rosen H, Cravatt BF. A global map of lipid-binding proteins and their ligandability in cells. Cell. 2015;161:1668–1680. doi: 10.1016/j.cell.2015.05.045. [DOI] [PMC free article] [PubMed] [Google Scholar]
- Picotti P, Aebersold R. Selected reaction monitoring-based proteomics: Workflows, potential, pitfalls and future directions. Nat Methods. 2012;9:555–566. doi: 10.1038/nmeth.2015. [DOI] [PubMed] [Google Scholar]
- Piel RB, 3rd, Shiferaw MT, Vashisht AA, Marcero JR, Praissman JL, Phillips JD, Wohlschlegel JA, Medlock AE. A novel role for progesterone receptor membrane component 1 (PGRMC1): A partner and regulator of ferrochelatase. Biochemistry. 2016;55:5204–5217. doi: 10.1021/acs.biochem.6b00756. [DOI] [PMC free article] [PubMed] [Google Scholar]
- Raghuram S, Stayrook KR, Huang P, Rogers PM, Nosie AK, McClure DB, Burris LL, Khorasanizadeh S, Burris TP, Rastinejad F. Identification of heme as the ligand for the orphan nuclear receptors REV-ERBalpha and REV-ERBbeta. Nat Struct Mol Biol. 2007;14:1207–1213. doi: 10.1038/nsmb1344. [DOI] [PMC free article] [PubMed] [Google Scholar]
- Robin AY, Krishna Kumar K, Westphal D, Wardak AZ, Thompson GV, Dewson G, Colman PM, Czabotar PE. Crystal structure of Bax bound to the BH3 peptide of Bim identifies important contacts for interaction. Cell Death Dis. 2015;6:e1809. doi: 10.1038/cddis.2015.141. [DOI] [PMC free article] [PubMed] [Google Scholar]
- Rostovtsev VV, Green LG, Fokin VV, Sharpless KB. A stepwise huisgen cycloaddition process: Copper(I)-catalyzed regioselective “ligation” of azides and terminal alkynes. Angew Chem Int Ed Engl. 2002;41:2596–2599. doi: 10.1002/1521-3773(20020715)41:14<2596::AID-ANIE2596>3.0.CO;2-4. [DOI] [PubMed] [Google Scholar]
- Savitski MM, Reinhard FB, Franken H, Werner T, Savitski MF, Eberhard D, Martinez Molina D, Jafari R, Dovega RB, Klaeger S, et al. Tracking cancer drugs in living cells by thermal profiling of the proteome. Science. 2014;346:1255784. doi: 10.1126/science.1255784. [DOI] [PubMed] [Google Scholar]
- Schenone M, Dančík V, Wagner BK, Clemons PA. Target identification and mechanism of action in chemical biology and drug discovery. Nat Chem Biol. 2013;9:232–240. doi: 10.1038/nchembio.1199. [DOI] [PMC free article] [PubMed] [Google Scholar]
- Scott DE, Coyne AG, Hudson SA, Abell C. Fragment-based approaches in drug discovery and chemical biology. Biochemistry. 2012;51:4990–5003. doi: 10.1021/bi3005126. [DOI] [PubMed] [Google Scholar]
- Sliwoski G, Kothiwale S, Meiler J, Lowe EW., Jr Computational methods in drug discovery. Pharmacol Rev. 2013;66:334–395. doi: 10.1124/pr.112.007336. [DOI] [PMC free article] [PubMed] [Google Scholar]
- Sumranjit J, Chung SJ. Recent advances in target characterization and identification by photoaffinity probes. Molecules. 2013;18:10425–10451. doi: 10.3390/molecules180910425. [DOI] [PMC free article] [PubMed] [Google Scholar]
- Swinney DC, Anthony J. How were new medicines discovered? Nat Rev Drug Discov. 2011;10:507–519. doi: 10.1038/nrd3480. [DOI] [PubMed] [Google Scholar]
- Tan S, Tan HT, Chung MC. Membrane proteins and membrane proteomics. Proteomics. 2008;8:3924–3932. doi: 10.1002/pmic.200800597. [DOI] [PubMed] [Google Scholar]
- Violante S, Ijlst L, Te Brinke H, Tavares de Almeida I, Wanders RJ, Ven-tura FV, Houten SM. Carnitine palmitoyltransferase 2 and carni-tine/acylcarnitine translocase are involved in the mitochondrial synthesis and export of acylcarnitines. FASEB J. 2013;27:2039–2044. doi: 10.1096/fj.12-216689. [DOI] [PubMed] [Google Scholar]
- Waki H, Park KW, Mitro N, Pei L, Damoiseaux R, Wilpitz DC, Reue K, Saez E, Tontonoz P. The small molecule harmine is an antidiabetic cell-type-specific regulator of PPARgamma expression. Cell Metab. 2007;5:357–370. doi: 10.1016/j.cmet.2007.03.010. [DOI] [PubMed] [Google Scholar]
- Wang J, Lazar MA. Bifunctional role of Rev-erbalpha in adipocyte differentiation. Mol Cell Biol. 2008;28:2213–2220. doi: 10.1128/MCB.01608-07. [DOI] [PMC free article] [PubMed] [Google Scholar]
- Washburn MP, Wolters D, Yates JR., 3rd Large-scale analysis of the yeast proteome by multidimensional protein identification technology. Nat Biotechnol. 2001;19:242–247. doi: 10.1038/85686. [DOI] [PubMed] [Google Scholar]
- Weerapana E, Speers AE, Cravatt BF. Tandem orthogonal proteolysis-activity-based protein profiling (TOP-ABPP)–a general method for mapping sites of probe modification in proteomes. Nat Protoc. 2007;2:1414–1425. doi: 10.1038/nprot.2007.194. [DOI] [PubMed] [Google Scholar]
- Weerapana E, Wang C, Simon GM, Richter F, Khare S, Dillon MB, Bachovchin DA, Mowen K, Baker D, Cravatt BF. Quantitative reactivity profiling predicts functional cysteines in proteomes. Nature. 2010;468:790–795. doi: 10.1038/nature09472. [DOI] [PMC free article] [PubMed] [Google Scholar]
- Weiss WA, Taylor SS, Shokat KM. Recognizing and exploiting differences between RNAi and small-molecule inhibitors. Nat Chem Biol. 2007;3:739–744. doi: 10.1038/nchembio1207-739. [DOI] [PMC free article] [PubMed] [Google Scholar]
- Wells JA, McClendon CL. Reaching for high-hanging fruit in drug discovery at protein-protein interfaces. Nature. 2007;450:1001–1009. doi: 10.1038/nature06526. [DOI] [PubMed] [Google Scholar]
- Welsch ME, Snyder SA, Stockwell BR. Privileged scaffolds for library design and drug discovery. Curr Opin Chem Biol. 2010;14:347–361. doi: 10.1016/j.cbpa.2010.02.018. [DOI] [PMC free article] [PubMed] [Google Scholar]
- Wendler A, Wehling M. PGRMC2, a yet uncharacterized protein with potential as tumor suppressor, migration inhibitor, and regulator of cytochrome P450 enzyme activity. Steroids. 2013;78:555–558. doi: 10.1016/j.steroids.2012.12.002. [DOI] [PubMed] [Google Scholar]
- Wu YH, Ko TP, Guo RT, Hu SM, Chuang LM, Wang AH. Structural basis for catalytic and inhibitory mechanisms of human prostaglandin reductase PTGR2. Structure. 2008;16:1714–1723. doi: 10.1016/j.str.2008.09.007. [DOI] [PubMed] [Google Scholar]
- Yang X, Lee WH, Sobott F, Papagrigoriou E, Robinson CV, Grossmann JG, Sundström M, Doyle DA, Elkins JM. Structural basis for protein-protein interactions in the 14-3-3 protein family. Proc Natl Acad Sci USA. 2006;103:17237–17242. doi: 10.1073/pnas.0605779103. [DOI] [PMC free article] [PubMed] [Google Scholar]
- Yin L, Wu N, Curtin JC, Qatanani M, Szwergold NR, Reid RA, Waitt GM, Parks DJ, Pearce KH, Wisely GB, Lazar MA. Rev-erbalpha, a heme sensor that coordinates metabolic and circadian pathways. Science. 2007;318:1786–1789. doi: 10.1126/science.1150179. [DOI] [PubMed] [Google Scholar]
Associated Data
This section collects any data citations, data availability statements, or supplementary materials included in this article.