

Abstract
Aim
To investigate the incidence of sight‐threatening diabetic retinopathy in Type 2 diabetes mellitus.
Background
In most countries, yearly or biennial screening intervals for diabetic retinopathy in people with Type 2 diabetes are recommended. Fewer screening sessions reduce the effort required of people with Type 2 diabetes and reduce healthcare costs.
Methods
We conducted a search of PubMed, Embase, Web of Science and the COCHRANE Library for studies published betweeen 1 January 2000 and 1 January 2017. Eligible studies were those that included general populations of >100 people with Type 2 diabetes mellitus. Additional study population criteria were absence of moderate diabetic retinopathy or more severe diabetic retinopathy at last screening session and at least two gradable retinal screening sessions. Outcomes of interest in the included studies were moderate and severe non‐proliferative diabetic retinopathy (R2), proliferative diabetic retinopathy (R3) or maculopathy (M1), collectively known as sight‐threatening or referable diabetic retinopathy.
Results
A total of 17 studies were included. In people with Type 2 diabetes without or with only mild diabetic retinopathy at baseline, the average incidence rates of sight‐threatening diabetic retinopathy were ~1 per 100 person‐years and ~8 per 100 person‐years, respectively. The average numbers needed to screen to detect one case of sight‐threatening diabetic retinopathy were 175 and 19 in people without and with mild retinopathy at last screening, respectively.
Conclusion
In people with Type 2 diabetes without retinopathy at last screening, the incidence of severe sight‐threatening retinopathy at the subsequent screening session was low. In people with mild retinopathy, progression to sight‐threatening diabetic retinopathy was nearly 10‐fold higher. This review supports lengthening of the screening interval of patients with Type 2 diabetes without retinopathy at last screening session.
What's new?
The incidence of sight‐threatening diabetic retinopathy (STDR) in people with Type 2 diabetes is decreasing, probably as a result of improving diabetes care.
In screen‐detected mild retinopathy (R1), regression to no visible retinopathy (R0) is common.
In people with mild retinopathy at baseline, development and detection of STDR by the time of the next screening visit is nearly 10 times more frequent than in people without retinopathy at baseline.
Recent data on incidence and numbers needed to screen can be helpful in constructing optimal intervals for the screening of the large population of people with Type 2 diabetes with no or only mild retinopathy.
Introduction
Diabetic retinopathy is a chronic, potentially sight‐threatening complication of diabetes mellitus that can be detected by periodic screening of the fundus. For the classification of diabetic abnormalities, two grading schemes are used: the Early Treatment Diabetic Retinopathy Study classification (ETDRS) and the more recent National Screening Committee (NSC) 1, 2. Absence of diabetic retinopathy is classified as ‘10’ (ETDRS) or ‘R0’ (NSC). Aneurysms and small retinal haemorrhages may progress to mild, non‐proliferative diabetic retinopathy or background diabetic retinopathy (ETDRS 20–35, NSC R1), or to moderate to severe non‐proliferative diabetic retinopathy (ETDRS 43–53, NSC R2), and ultimately to proliferative diabetic retinopathy (ETDRS ≥61, NSC R3) 1, 2. It is estimated that this progressive pattern takes on average ~17 years 3, 4. Regression from mild non‐proliferative diabetic retinopathy (R1) to no visible retinopathy occurs in up to 46% of cases 3, 5, 6, 7, 8. This regression is reinforced by effective treatment of hypertension and hyperglycaemia 3, 9.
Diabetic maculopathy or macular oedema (NSC M1) represents a spectrum of retinopathy symptoms characterized by oedema, fine macular exudates with or without haemorrhages and thickening of the central macula and surrounding non‐central macula. The gradings R2, R3 and M1 are classified as sight‐threatening diabetic retinopathy (STDR) or referable diabetic retinopathy.
Proliferative diabetic retinopathy (R3) is an urgent sight‐threatening condition, which needs a fast‐track referral for ophthalmological treatment to prevent loss of vision. All screen‐detected STDRs need comprehensive diagnosis, monitoring, and eventually treatment by an ophthalmologist. Timely screen detection of STDR and referral and treatment can prevent or slow down loss of visual acuity.
The incidence of STDR has decreased over the last decades 10, 11. Between 1991 and 2006, the screen‐detected prevalence of all referable diabetic retinopathy (R2 or R3 or M1) cases increased from 2.0% to 4.7% in the UK, but in that period the prevalence of the most severe STDR (R3 or M1) dropped by 91%: from 1.7% to 0.16% 12. Several authors suggest extending the screening interval for people with Type 2 diabetes without retinopathy at last screening session 13, 14, 15, 16 to 2 12, 17 or 3 years 18, 19, 20.
We present a systematic review of current population‐based screen‐detected incidences and numbers needed to screen for STDR in Type 2 diabetes to contribute to the discussion concerning the length of the diabetic retinopathy screening interval in people with Type 2 diabetes. The questions addressed are: (1) the incidence of moderate to severe non‐proliferative diabetic retinopathy, proliferative retinopathy and diabetic maculopathy (STDR) in people with Type 2 diabetes without pre‐existing diabetic retinopathy or with only background or mild non‐proliferative diabetic retinopathy at baseline, and (2) the number of screening sessions needed to detect one case of severe non‐proliferative diabetic retinopathy, proliferative diabetic retinopathy and diabetic maculopathy (STDR) in people with Type 2 diabetes without diabetic retinopathy or with only background or mild non‐proliferative diabetic retinopathy at baseline.
Participants and methods
Eligibility criteria
We searched for studies published between 1 January 2000 and 1 January 2017, in the English language, whose outcomes were incidence of severe non‐proliferative diabetic retinopathy, proliferative diabetic retinopathy, diabetic maculopathy, referable diabetic retinopathy or STDR. The study samples were general populations with Type 2 diabetes (N >100), not participating in a diabetes‐related trial, who had no diabetic retinopathy (ETDRS 10 or NSC R0) at last screening session, i.e. at baseline, or only minimal background or non‐proliferative diabetic retinopathy (EDTRS >10 and <35 or NSC R1) at last screening, i.e. at baseline. The study populations were required to have undergone at least two gradable retinal screening sessions.
Information sources
The literature search was performed by an expert librarian on 3 January 2017. Databases searched were PubMed, Embase, Web of Science and the COCHRANE Library.
Search strategy PubMed
Search terms used were: ((((“STDR”[tiab] OR ((“Diabetic Retinopathy”[mesh] OR ((“diabetic”[all fields]) AND (“retinopathy”[all fields] OR (“macular oedema”) OR “maculopathy”[all fields] OR “CSME”[all fields] OR “retinopathies”[all fields]))) AND (“sight threatening”[all fields] OR “sight‐threatening”[all fields] OR “progressive”[All fields] OR “proliferative”[all fields] OR “referable”[all fields]))) AND (“Incidence”[Mesh] OR “incidence”[all fields]))). The filters applied were English language and publication date range from 1 January 2000 to 1 January 2017.
Selection of publications and extraction of data
Two authors (Y.G. and D.T.) selected the papers independently. Papers were screened for eligibility by title and, if necessary, by examining the abstract. No systematic reviews were found in the literature search. Only a few discrepancies in the selections of the two authors occurred. These were discussed and consensus was reached in line with our search criteria. We contacted the corresponding authors of three papers. One author group provided non‐published data on the number of screening sessions, which we used in the present review 14. Two author groups did not answer repeated requests for information. Their papers were not included because interpretable data were missing.
Outcomes
We report the yearly incidence of STDR in systematically screened, non‐selected people with Type 2 diabetes, free from screen‐detected retinopathy (R0) or maculopathy (M0) or with minimal screen detected retinopathy (R1) at last screening session, as well as the resulting numbers needed to screen to detect one case of STDR. The incidence rates of STDR are calculated as incidence rate per 100 person‐years or as mean cumulative incidence per 100 participants per year of follow‐ up.
Baseline participant characteristics are provided where these were reported in the included studies.
Statistical analysis
Incidence rates
If the study mentioned the yearly number of people at risk plus the yearly number of detected retinopathy cases, incidence was presented as incidence rate. ‘Incidence rate’ was numerically defined as the number of new cases of severe diabetic retinopathy within a time period, as a proportion of the number of people at risk of severe diabetic retinopathy.
If only the number of yearly screening sessions was presented, we equated these with person‐years 7. Incidence rates are presented in Tables 2 and 3.
Table 2.
Number of people with Type 2 diabetes without diabetic retinopathy at baseline and number of events and incidence rate of screen‐detected sight‐threatening diabetic retinopathy during follow‐up per 100 person‐years or per 100 screening‐sessions
| Author | Person‐years or screening‐sessions | R2 level Number, incidence rate (95% CI) | R3 level Number, incidence rate (95% CI) | M1 Number, incidence rate (95% CI) | Incidence rate per 100 person‐years or 100 screening‐ sessions (95% CI) |
|---|---|---|---|---|---|
| Younis et al. [18] | 13,053 |
76 0.58 (0.5‐0.7) ETDRS ≥ 40 |
58 0.44 (0.3‐0.6) |
1.02 (0.9‐1.2) | |
| Sloan et al. [22] | 31,722 | ‐ |
63 0.2 (0.2‐0.2) |
124 0.39 (0.4‐0.4) |
0.59 (0.57‐0.62) |
| Jones et al. [14] | 57,385 |
763 1.33 (1.2‐1.4) |
1.33 (1.2‐1.4) | ||
| Looker et al. [7] | 300,817* |
282 0.1 (0.1‐0.1) |
1605 0.5 (0.5‐0.6) |
0.6 (0.6‐0.7) | |
| Liu et al. [3] | 36,574 |
100 0.27 (0.2‐0.3) ETDRS ≥ 53 |
‐ | 0.27 (0.2‐0.3) | |
| Salinero‐Fort et al. [26] | 7,984 |
11 0.14 (0.1‐0.2) |
68 0.85 (0.7‐1.1) |
30 0.38 (0.3‐0.5) |
1.37 (1.1‐1.6) |
| Martin‐Merino et al. [27] | 282,850 | ‐ | ‐ |
885 0.30 (0.3‐0.3) |
0.30 (0.3‐0.3) |
| Yun et al. [4] | 2,092 |
32 1.5 (1.0‐2.2) |
‐ | 1.5 (1.0‐2.2) | |
ETDRS, Early treatment diabetic retinopathy study.
*Screening‐sessions.
Table 3.
Number of people with Type 2 diabetes with diabetic retinopathy at baseline, number of events during follow‐up and incidence rate of screen‐detected sight‐threatening diabetic retinopathy during follow‐up per 100 person‐years or per 100 screening‐sessions
| Person‐years | Retinopathy status at first screening R1 | R2 Level Number, incidence rate (95% CI) | R3 level Number, incidence rate (95% CI) | Maculopathy M1 Number, incidence rate (95%CI) | Incidence rate per 100 person‐years or 100 screening‐sessions (95% CI) | |
|---|---|---|---|---|---|---|
| Younis et al. [18] | 2,795 |
Background DR ETDRS 20‐40 |
150 5.4 (4.6‐6.3) ETDRS > 40 |
127 4.5 (3.8‐5.4) |
9.9 (8.8‐11.2) | |
| Jones et al. [14] | 8,443 | NPDR |
475 5.63 (5.1‐6.2) |
5.63 (5.1‐6.2) | ||
| Looker et al. [7] | 104,133* | Mild background DR |
808 0.8 (0.7‐0.8) |
4,457 4.3 (4.2‐4.4) |
5.1 (5.0‐5.2) | |
DR, Diabetic retinopathy; ETDRS, Early treatment diabetic retinopathy study; NPDR, Non‐proliferative retinopathy; PDR, Proliferative retinopathy; STDR, Sight threatening diabetic retinopathy.
*Screening‐sessions.
Cumulative incidence
If yearly numbers of people at risk were not available, cumulative incidence over the study period was calculated; therefore, we divided the total number of incident cases by the number of participants. Taking into account the duration of the study follow‐up, the mean yearly cumulative incidence is reported in Tables 4 and 5. For duration of follow‐up we took the total length of follow‐up, if this was equal for all included participants, or the median length of follow‐up for studies in which the follow‐up varied.
Table 4.
Number of people with Type 2 diabetes without diabetic retinopathy at baseline, number of events and cumulative incidence of screen‐detected sight‐threatening diabetic retinopathy during follow‐up per year
| Author | Partici‐pants | R2 Level Number, Cumulative incidence (95% CI) | R3 level Number, Cumulative incidence (95% CI) | Maculopathy M1 Number, Cumulative incidence (95% CI) | Cumulative incidence of sight threatening diabetic retinopathy per year of follow‐up (95% CI) |
|---|---|---|---|---|---|
| Stratton et al. [21] | 1,216 |
17 1.4 (0.9‐2.2) |
1 0.1 (0.0‐0.5) |
– | 0.25 (0.1‐0.7) |
| Leske et al. [24] | 324 | 9.0 (5.5‐12.4) | 2.6 (1.0‐4.3) | 8.7 (5.4‐12.0) | 0.92 |
| Cikamatana et al. [25] | 90 | 0 | 0 | – | 0 (0‐4.1) |
| Olafsdottir and Stefansson [17] | 199 |
12 6.03 (3.5‐10.2) |
2 1.01 (0.3‐0.6) |
4 2.01 (0.8‐5.1) |
0.91 (0.3‐3.6) |
| Agardh and Tababat‐Khani [19] | 1,322 | – | 0 |
3 0.23 (0.1‐0.7) |
0.08 (0.0‐0.4) |
| Song et al. [5] | 3,647 |
25 0.69 (0.5‐1.0) |
5 0.14 (0.1‐0.3) |
– | 0.21 (0.1‐0.4) |
| Thomas et al. [15] | 49,763 |
126*
0.25 (0.2‐0.3) |
28 **
0.06 (0.0‐0.1) |
197 0.40 (0.3‐0.5) |
0.19 (0.1‐0.2) |
| Scanlon et al. [20] | 12,491 |
74***
0.59 (0.5‐0.7) |
9 0.07 (0.0‐0.1) |
361 2.89 (2.6‐3.2) |
1.04 (0.9‐1.2) |
| Van der Heijden et al. | 2,980 | – | 311.0 (0.7‐1.5) | 0.22 (0.1‐0.5) | |
16 patients had also maculopathy.
3 patients had also maculopathy.
R2 or R3.
Table 5.
Number of people with Type 2 diabetes with diabetic retinopathy at baseline, number of events and cumulative incidence of screen‐detected sight‐threatening diabetic retinopathy during follow‐up per year
| Author | Participants | Retinopathy status at first screening R1 | R2 Level Number, Cumulative incidence (95% CI) | R3 level Number, Cumulative incidence (95% CI) | Maculopathy M1Number, Cumulative incidence (95% CI) | Cumulative incidence of sight threatening diabetic retinopathy per year of follow‐up (95% CI) |
|---|---|---|---|---|---|---|
| Stratton et al. [21] | 656 |
Mild NPDR ETDRS 20‐35 |
27 4.12 (2.8‐5.9) |
1 0.15 (0.0‐0.9) |
– | 0.71 (0.3‐1.7) |
| Cikamatana et al. [25] | 39 |
Questionable, minimal and mild NPDR ETDRS 14‐35 |
5 12.8 (6‐27) ETDRS 47 |
0 0 (0‐9) |
– | 2.6 (1.5‐13.6) |
| Song et al. [5] | 1,387 |
Mild NPDR ETDRS 20‐35 |
81 5.84 (4.7‐7.2) ETDRS > 43 |
5 0.36 (0.2‐0.8) |
– | 1.55 (1.0‐2.4) |
| Scanlon et al. [20] | 6,553 |
Mild NPDR ETDRS 20‐35 |
542 8.27 (7.6‐9.0) R2 or R3 |
34 0.52 (0.4‐0.7) R3 |
878 13.4 (12.6‐14.2) |
6.53 (6.0‐7.2) |
| Van der Heijden et al. [23] | 302 |
Mild NPDR ETDRS 20‐35 |
27 8.9 (6.2‐12.7) ETDRS > 43 |
– | 1.99 (0.9‐4.3) | |
ETDRS, Early treatment diabetic retinopathy study; NPDR, Non‐proliferative retinopathy; PDR, Proliferative retinopathy; STDR, Sight threatening diabetic retinopathy.
Confidence intervals of incidence rates were calculated using the Rothman/Greenland formula, and confidence intervals of cumulative incidences using the Wilson formula.
If the number of screening sessions was presented in the study, the quotient of screening sessions and detected STDR cases during these sessions was used to calculate the number needed to screen to detect one case of STDR. The mean numbers needed to screen are presented as weighted means. For each study, we therefore used the total number of screen‐detected STDR cases as value and the total number of screening sessions as weight (http://www.thinkcalculator.com/statistics/weighted-mean-calculator.php; Tables 6 and 7).
Table 6.
Number of people with Type 2 diabetes without diabetic retinopathy at baseline, number of screening sessions, and number needed to detect one person with sight‐threatening diabetic retinopathy with and without maculopathy
| Number of events and number ofscreeningsessions | Outcome | |||||||
|---|---|---|---|---|---|---|---|---|
| Author | Participants with PDR* (R3) | Participants with severe NPDR or PDR* (R2 or R3) | Participants with maculopathy (M1) | Total number of screening sessions with 1–1.5‐year interval | Number of screening sessions needed to detect one case of PDR* (R3) | Number of screening sessions needed to detect one case of severe NPDR or PDR* (R2 or R3) | Number of screening sessions needed to detect one case of maculopathy (M1) | Number of screening sessions needed to detect one case of STDR |
| Younis et al. 18 | ‐ | 76 | 58 | 20.570 | ‐ | 271 | 355 | 154 |
| Thomas et al. 15 | 28 | 151 | 197 | 93.069 | 3324 | 616 | 472 | 267 |
| Jones et al. 14 | 24 | 423 | 36 | 33.164 | 1382 | 78 | 921 | 74 |
| Looker et al. 7 | ‐ | 282 | 1605 | 300.817 | ‐ | 1067 | 187 | 159 |
| Liu et al. 3 | 100 ETDRS ≥ 53 | 875† ETDRS 43–53 | ‐ | 49.959 |
500 ETDRS ≥ 53 |
57†
ETDRS 43‐53 |
‐ | ‐ |
| Martin‐Merino et al. 27 | 885 | 282.841 | ‐ | ‐ | 320 | ‐ | ||
| Weighted mean number of screening‐sessions needed to detect one referable case | 2158 | 782 | 313 | 175 | ||||
ETDRS, Early Treatment Diabetic Retinopathy study; NPDR, non‐proliferative diabetic retinopathy; PDR, proliferative diabetic retinopathy; STDR, sight‐threatening diabetic retinopathy. *Fast‐track referral necessary. †Only R2.
Table 7.
Number of people with Type 2 diabetes with mild diabetic retinopathy at baseline, number of screening sessions, and number needed to detect one person with sight‐threatening diabetic retinopathy with and without maculopathy
| Author | Participants with PDR* (R3) | Participants with severe NPDR or PDR (R2 or R3) | Participants with maculopathy (M1) | Total number of screens with 1–1.5‐year interval | Number of screening sessions needed to detect one case with PDR (R3) (fast‐track referral necessary) | Number of screening sessions needed to detect one case with severe NPDR or PDR (R2 or R3) | Number of screening sessions needed to detect one case of maculopathy | Number of screening sessions needed to detect one case of STDR |
|---|---|---|---|---|---|---|---|---|
| Younis et al. 18 | ‐ | 150 | 127 | 1,845 | ‐ | 12.3 | 14.5 | 6.7 |
| Jones et al. 14 | 37 | 889 | 103 | 8,240 | 223 | 9.3 | 80 | 8.3 |
| Looker et al. 7 | 808 | 4,457 | 104,133 | ‐ | 129 | 23 | 19.8 | |
| Weighted mean number of screening sessions to detect one referable case | 118 | 27 | 18.9 | |||||
NPDR, non‐proliferative diabetic retinopathy; PDR, proliferative diabetic retinopathy; STDR, sight‐threatening diabetic retinopathy.
Results
Of the 692 unique records that were identified in the systematic search, 51 qualified for full‐text evaluation (Fig. 1). A total of 17 studies met the inclusion criteria (Table 1 3, 4, 5, 7, 14, 15, 17, 18, 19, 20, 21, 22, 23, 24, 25, 26, 27). Fourteen studies were based on predominantly white populations in one of 10 different Western countries. One study described a population in South Korea, one in Hong Kong and one in Barbados. Nine studies reported the incidence of STDR in participants without diabetic retinopathy at last screening session and eight studies also documented people with only mild non‐proliferative diabetic retinopathy at last screening session. Most data were derived from screening programmes. The mean age of the participants varied among studies from 52.2 21 to 74.8 22 years. Glycaemic control of the participants, as far as reported, was good to moderate except for hyperglycaemia in the Barbados cohort.
Figure 1.
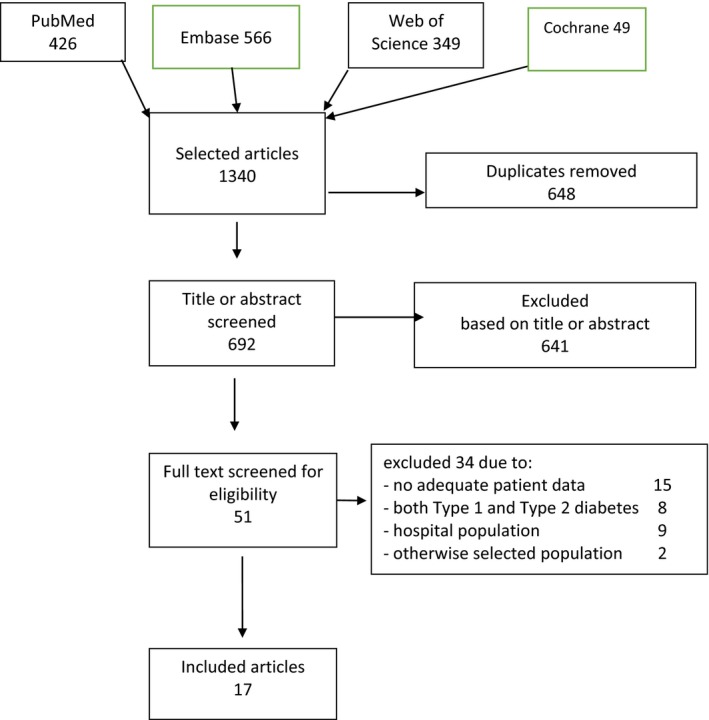
Flow diagram of sources and numbers of included papers.
Table 1.
Screening studies reporting incidence of sight‐threatening diabetic retinopathy in Type 2 diabetes 2000–2017
| Author | Publication year | Location | Study period | Duration of follow‐up, years | Screening interval, years | Screening method, per eye | Mean ± sd age (years) at first screening | Mean ± sd diabetes duration (years) at first screening | Mean HbA1c or FBG at first screening, mmol/(%) | Participants without diabetic retinopathy at first screening | Participants with mild diabetic retinopathy at first screening |
|---|---|---|---|---|---|---|---|---|---|---|---|
| Stratton et al. 21 | 2001 | England, UK | 1983– | 6 | 3 | Retinal photographs, not specified | 52.2 ± 8.5 | 0 |
53 ± 12.9 (7.0 ± 1.7) |
1216 | 639 |
| Younis et al. 18 | 2003 | England, UK | 1991–1999 | 5 | 1.5 | Three overlapping photographs | 63.4 ± 6.9 | 3.0 | ‐ | 3743 | 810 |
| Leske et al. 24 | 2006 | Barbados | 1992–1999 | 5 | 4.6 | Standard fundus photographs of fields 1 and 2 (ETDRS 1985) | 61.9 | 7.3 ± 7.4 |
94 ± 12 (10.8 ± 3.3) |
324 | ‐ |
| Cikatamana et al. 25 | 2007 | Australia | 1987–2003 | 9 | 4.5 | Stereo‐ and non‐stereo photographs of five fields | 57.6 ± 9.4 | 5.8 ± 7.5 | FBG 8.1 ± 3.3 | 97 | 39 |
| Olafsdottir and Stefansson 17 | 2007 | Iceland | 1995–2005 | 10 | 2 | Slit‐lamp with a 90‐diopter lens and colour photographs | ‐ | ‐ | ‐ | 199 | ‐ |
| Sloan et al. 22 | 2008 | USA | 1999–2006 | 6 | 1 | Unknown |
74.8 (only 65+ patients) |
‐ | ‐ | 30,722 | ‐ |
| Agardh and Tababat‐Khani 19 | 2011 | Sweden | 2006–2009 | 3 | 3 | Two 50° red‐free fundus photographs | 60 ± 12 | 6 ± 6 |
46 ± 10.8 (6.4 ± 1.5) |
1691 | ‐ |
| Song et al. 5 | 2011 | Hong Kong | 2005–2009 | 4 | 1 | Nine 45° field digital fundus photographs | 62.6 ± 9.6 | ‐ | ‐ | 3647 | 1387 |
| Thomas et al. 15 | 2012 | Wales, UK | 2005–2009 | 4 | 1.36 | Two 45° digital retinal images | 64.4 ± 11.3 | 4.2 ± 4.4 | ‐ | 49 763 | ‐ |
| Jones et al. 14 | 2012 | England, UK | 1990–2006 | 17 | 1.5 | Two photographs | 66.7 | 2.5 | ‐ | 16 444 | 3632 |
| Looker et al. 7 | 2013 | Scotland, UK | 2005–2011 | 5 |
1.05 (1.01‐1.16)* |
Photography (if ungradable: slit lamp) | 64.4 ± 11.8 | 4.1 (1.6–7.5)* |
56 ± 17 (7.3 ± 1.5) without DR 60 ± 17 (7.6 ± 1.6) with mild DR |
101 539 | 35 227 |
| Scanlon et al. 20 | 2013 | England, UK | 2005–2011 | 3.4 | 1.125 | Two field 45° digital retinal images | 66 (57‐74)* | ‐ | ‐ | 12 491 | 6553 |
| Liu et al. 3 | 2013 | Scotland, UK | 1990–2011 | 21 | 1 | Single‐field 45‐degree retinal photographs | ‐ | 0.5 | 55 (7.2); longitudinal mean | 4662 | ‐ |
| Salinero‐Fort et al. 26 | 2013 | Spain | 2008–2011 | 4 | 1 | Slit lamp biomicro‐ scopy | 67.8 | 7.7 (7.1) | 53 ± 12 (7.0 ±1.1) | 2405 | ‐ |
| Martin‐Merino et al. 27 | 2014 | UK | 2000–2007 | 9 | ‐ | Unknown | Diabetes onset 61.3 | 0 | ‐ | 63 226 | ‐ |
| Van der Heijden et al. 23 | 2014 | Netherlands | 1998–2010 | 4.4 | 2.5 | Two 45° photographs | 60.5 | 1.35 | 60 (7.6) | 2980 | 302 |
| Yun et al. 4 | 2016 | South Korea | 2001–2005 | 11.8 (9.8‐13.2)* | 1 | One 45° fundus photograph | 54.3 ± 10.0 | 6.7 ± 3.5 | 66 ± 13 (8.2 ± 1.2) | 523 | ‐ |
FBG, fasting blood glucose. *Interquartile range.
The screening interval varied from 1 to 10 years and study duration from 3 to 17 years (Table 1).
Tables 2 and 4 present the incidence of STDR in people with Type 2 diabetes without diabetic retinopathy at last screening session. Tables 3 and 5 present the incidence of STDR in people with Type 2 diabetes with only mild non‐proliferative diabetic retinopathy at last screening session.
The incidence rates were reported in eight studies (Tables 2 and 3). In the other nine studies, cumulative incidence was used as the outcome measure (Tables 4 and 5). Incidence rate is the most precise estimate of incidence. Cumulative incidence has an unknown dropout rate.
The STDR incidence rates of people without retinopathy at last screening session varied from 0.27 3 to 1.5 4 per 100 person‐years (Table 2). The studies reported different types of STDR, therefore, results are only partially comparable. Three‐dimensional maculopathy was not taken into account in the ETDRS classification and was not always recorded.
The rate of progression to STDR in people with only mild diabetic retinopathy at last screening session was substantially higher. The incidence rate varied from 5.1 7 to 9.9 18 (Table 3).
The mean yearly cumulative incidence of people without retinopathy at last screening session varied from 0.08 19 to 1.04 20 (Table 4). People with only mild retinopathy at last screening session had cumulative incidences from 0.72 21 to 6.5 20 (Table 5).
Numbers needed to screen
In six studies the number of screening sessions was available and for these studies we calculated the number of individual screening sessions needed to detect one case of R3; R2 or R3; M1 or STDR (Tables 6 and 7).
Proliferative retinopathy was detected at only one in ~2000 screening sessions in people without diabetic retinopathy at last screening session. Proliferative retinopathy is always an indication for immediate referral to an ophthalmologist. Detection of maculopathy occurs more frequently; ~300 screening sessions are needed to detect maculopathy in people without diabetic retinopathy at last screening session. In people with mild diabetic retinopathy at last screening session, the screening yield is considerably higher than in people without diabetic retinopathy. The numbers needed to screen were 19 and 175 in people with and without diabetic retinopathy, respectively (Tables 6 and 7).
Discussion
Strengths of the present review include the fact that it provides a representative overview of diabetic retinopathy screening, based on large and global populations of people with Type 2 diabetes. Seventeen studies in 13 countries on four continents were included, and participants comprised totals of 326 112 people without any retinopathy and 48 610 people with only mild retinopathy. In addition, the review outcomes are of great relevance. There is an ongoing debate about the optimal screening interval for diabetic retinopathy. Up‐to‐date information on representative retinopathy incidence is crucial for confirmation and development of screening procedures.
The study also has some limitations. First, the inclusion criteria of the described cohort studies were different and probably had an effect on the outcomes of these studies. In studies focusing on people without retinopathy at baseline, people with existing diabetic retinopathy were excluded; therefore, the included participants in these studies were presumably healthier and more resistant to development of microvascular complications than those excluded. The diabetic retinopathy incidence was not comparable between people with an unknown duration of Type 2 diabetes without retinal screening on one hand and people receiving intermittent retinal screening on the other hand.
Second, none of the included studies present data on the final diabetic retinopathy diagnosis by an ophthalmologist after referral, therefore, the accuracy of the screening results is uncertain; however, comparison of classification errors made by diabetic retinopathy screening service graders and errors made by hospital eye service doctors showed more over‐gradings in the screening service and more under‐gradings in the hospital service 33.
Third, maculopathy, a tri‐dimensional sight‐threatening abnormality, was not always reported in the included studies and may have been missed by photography. If reported, maculopathy forms the bulk of STDR incidences 7, 20, 22; therefore, availability of maculopathy data influences the STDR results significantly.
Fourth, because of unknown drop‐out numbers in the studies, cumulative incidence was possibly underestimated; however, all people were screened at least twice, thereby meeting the study selection criteria of the present review. Durations of the included studies were quite short, and cumulative incidences and incidence rates did not differ significantly.
Fifth, classification of diabetic retinopathy is a challenging task and different scales and grading protocols were used among the different populations 34. In one study maculopathy was only diagnosed if the visual acuity of the affected eye was <0.5 20. Commonly used terms, such as ‘referable’ and ‘observable’ are not uniformly defined, even in most national retinopathy screening guidelines. We equated ‘referable’ diabetic retinopathy with STDR. Moreover, there will be differences in interpretation and judgement 35. Misclassification may have occurred, particularly because interpretation of fundus photographs is equivocal.
In summary, the two main findings of the present review are important to consider when verifying and developing retinopathy screening guidelines in people with Type 2 diabetes. First, the incidence of STDR with no pre‐existing retinopathy was low. Studies suggest that there is an overall downward trend in incidence 10, 11, 12. Second, the incidence rate for STDR in people with pre‐existing mild retinopathy is almost 10‐fold higher than in people without retinopathy at last screening session.
The implications of these findings are also twofold. First, we suggest that the screening interval for people with Type 2 diabetes without retinopathy should be widened. It is common to screen for retinopathy once every 1–3 years 16. In nine of the studies included in the present review, the authors suggested that the screening interval for Type 2 diabetes without retinopathy at last screening session be extended 12, 13, 14, 15, 16, 17, 18, 19, 20. We found three systematic reviews focusing on the effect of screening intervals on the incidence of STDR and visual loss 28, 29, 30. One of these studies reported insufficient evidence to change the screening interval 28; however, two studies concluded that a 2‐year screening interval for people with no diabetic retinopathy at baseline may be safely adopted instead of a 1‐year screening interval 29, 30. An extensive Health Technology Assessment concluded that a 3‐year screening interval for all people with diabetes is most likely to be cost‐effective 31. More recently, Sabanayagam et al. 32 published a systematic review of the incidence of STDR in Type 2 diabetes. They found similar cumulative incidence of proliferative retinopathy and progression. Our searches hardly found any overlap in selected papers. The narrow focus of the present review on population‐based, systematic retinopathy screening of people with Type 2 diabetes, without or with only mild retinopathy makes our results more specific for assessment of screening guidelines for the majority of people with Type 2 diabetes.
Other than the low incidence of STDR in screening of people with Type 2 diabetes without retinopathy at baseline, there are several other, but related, reasons to argue for the widening of the retinopathy screening interval for people without pre‐existing retinopathy. Firstly, severe diabetic retinopathy in Type 2 diabetes is uncommon and develops slowly; therefore, it is very unlikely that development of non‐proliferative retinopathy to severe or proliferative retinopathy will occur within 3 years if there are no signs of retinopathy at last screening session. Secondly, regular screening for retinopathy is time‐consuming and expensive for people with Type 2 diabetes and for the healthcare system. Reduction of the number of screening sessions reduces the impact on people with Type 2 diabetes and the health system. Moreover, annual screening for diabetic retinopathy is associated with a disproportionate number of false‐positive results or over‐referrals 31. In light of this, evidence‐based revision of the screening interval for people without retinopathy at last screening‐session is desirable.
The second implication of the present review is that an adapted screening interval for people with only mild retinopathy at last screening session is useful. As progression is slow and regression is common in screen‐detected mild retinopathy, referral is not necessary for people with only mild retinopathy. Instead, continuing the screening with an interval of 1 year is adequate to observe progression.
Future research should include use of the personal and disease characteristics of people with diabetes, screening data and definitive ophthalmic retinopathy diagnosis. This will help to optimize the screening interval for diabetic retinopathy.
In conclusion, in people with Type 2 diabetes without retinopathy at last screening session, incidence and progression to STDR was low. Widening of the screening interval is possible. In people with Type 2 diabetes with only mild retinopathy at last screening session, progression to STDR was significantly higher. These two findings should be considered in the development of national guidelines for diabetic retinopathy screening.
Funding sources
None.
Competing interests
None declared.
Diabet. Med. 36: 1199–1208(2019)
References
- 1. Early Treatment Diabetic Retinopathy Study Research Group . Fundus photographic risk factors for progression of diabetic retinopathy. ETDRS report number 12. Ophthalmology 1991; 98: 823–833. [PubMed] [Google Scholar]
- 2. Harding S, Greenwood R, Aldington S, Gibson J, Owens D, Taylor R et al Grading and disease management in national screening for diabetic retinopathy in England and Wales. Diabet Med 2003; 20: 965–971. [DOI] [PubMed] [Google Scholar]
- 3. Liu Y, Wang M, Morris AD, Doney AS, Leese GP, Pearson ER et al Glycemic exposure and blood pressure influencing progression and remission of diabetic retinopathy: a longitudinal cohort study in GoDARTS. Diabetes Care 2013; 36: 3979–3984. [DOI] [PMC free article] [PubMed] [Google Scholar]
- 4. Yun JS, Lim TS, Cha SA, Ahn YB, Song KH, Choi JA et al Clinical course and risk factors of diabetic retinopathy in patients with type 2 diabetes mellitus in Korea. Diabetes Metab J 2016; 40: 482–493. [DOI] [PMC free article] [PubMed] [Google Scholar]
- 5. Song H, Liu L, Sum R, Fung M, Yap MK. Incidence of diabetic retinopathy in a Hong Kong Chinese population. Clin Exp Optom 2011; 94: 563–567. [DOI] [PubMed] [Google Scholar]
- 6. Zavrelova H, Hoekstra T, Alssema M, Welschen LM, Nijpels G, Moll AC et al Progression and regression: distinct developmental patterns of diabetic retinopathy in patients with type 2 diabetes treated in the diabetes care system West‐Friesland. Diabetes Care 2011; 34: 867–872. [DOI] [PMC free article] [PubMed] [Google Scholar]
- 7. Looker HC, Nyangoma SO, Cromie DT, Olson JA, Leese GP, Philip S et al Predicted impact of extending the screening interval for diabetic retinopathy: the Scottish Diabetic Retinopathy Screening programme. Diabetologia 2013; 56: 1716–1725. [DOI] [PMC free article] [PubMed] [Google Scholar]
- 8. Andersen N, Hjortdal J, Schielke K, Bek T, Grauslund J, Laugesen CS et al The Danish registry of diabetic retinopathy. Clin Epidemiol 2016; 8: 613–619. [DOI] [PMC free article] [PubMed] [Google Scholar]
- 9. Jin P, Peng J, Zou H, Wang W, Fu J, Shen B et al The 5‐year onset and regression of diabetic retinopathy in Chinese type 2 diabetes patients. PLoS One 2014; 9: e113359. [DOI] [PMC free article] [PubMed] [Google Scholar]
- 10. Wong TY, Mwamburi M, Klein R, Larsen M, Flynn H, Hernandez‐Medina M et al Rates of progression in diabetic retinopathy during different time periods: a systematic review and meta‐analysis. Diabetes Care 2009; 32: 2307–2313. [DOI] [PMC free article] [PubMed] [Google Scholar]
- 11. Forster AS, Forbes A, Dodhia H, Connor C, Du Chemin A, Sivaprasad S et al Changes in detection of retinopathy in type 2 diabetes in the first 4 years of a population‐based diabetic eye screening program: retrospective cohort study. Diabetes Care 2013; 36: 2663–2669. Erratum in: Diabetes Care 2014; 37: 2063. [DOI] [PMC free article] [PubMed] [Google Scholar]
- 12. Misra A, Bachmann MO, Greenwood RH, Jenkins C, Shaw A, Barakat O et al Trends in yield and effects of screening intervals during 17years of a large UK community‐based diabetic retinopathy screening programme. Diabet Med 2009; 26: 1040–1047. [DOI] [PubMed] [Google Scholar]
- 13. Vijan S, Hofer TP, Hayward RA. Cost‐utility analysis of screening intervals for diabetic retinopathy in patients with type 2 diabetes mellitus. JAMA 2000; 283: 889–896. [DOI] [PubMed] [Google Scholar]
- 14. Jones CD, Greenwood RH, Misra A, Bachmann MO. Incidence and progression of diabetic retinopathy during 17 years of a population‐based screening program in England. Diabetes Care 2012; 35: 592–596. [DOI] [PMC free article] [PubMed] [Google Scholar]
- 15. Thomas RL, Dunstan F, Luzio SD, Chowdury SR, Hale SL, North RV et al Incidence of diabetic retinopathy in people with type 2 diabetes mellitus attending the diabetic retinopathy screening service for Wales: retrospective analysis. BMJ 2012; 344: e874. [DOI] [PMC free article] [PubMed] [Google Scholar]
- 16. Weltermann B, Reinders S, Bettin M, Gesenhues S, Hermann M. Screening für diabetische Retinopathie bei Typ‐2‐diabetes: Eine kritische Evaluation der jährlichen Routine [Screening for diabetic retinopathy in type 2 diabetes: a critical review of an annual routine]. Z Evid Fortbild Qual Gesundhwes 2013; 107: 403–409. [DOI] [PubMed] [Google Scholar]
- 17. Olafsdottir E, Stefansson E. Biennial eye screening in patients with diabetes without retinopathy: 10‐year experience. Br J Ophthalmol 2007; 91: 1599–1601. [DOI] [PMC free article] [PubMed] [Google Scholar]
- 18. Younis N, Broadbent DM, Vora JP, Harding SP. Incidence of sight‐threatening retinopathy in patients with type 2 diabetes in the Liverpool Diabetic Eye Study: a cohort study. Lancet 2003; 361: 195–200. [DOI] [PubMed] [Google Scholar]
- 19. Agardh E, Tababat‐Khani P. Adopting 3‐year screening intervals for sight‐threatening retinal vascular lesions in type 2 diabetic subjects without retinopathy. Diabetes Care 2011; 34: 1318–1319. [DOI] [PMC free article] [PubMed] [Google Scholar]
- 20. Scanlon PH, Stratton IM, Histed M, Chave SJ, Aldington SJ. The influence of background diabetic retinopathy in the second eye on rates of progression of diabetic retinopathy between 2005 and 2010. Acta Ophthalmol 2013; 91: e335–e339. [DOI] [PMC free article] [PubMed] [Google Scholar]
- 21. Stratton IM, Kohner EM, Aldington SJ, Turner RC, Holman RR, Manley SE et al UKPDS 50: risk factors for incidence and progression of retinopathy in type II diabetes over 6 years from diagnosis. Diabetologia 2001; 44: 156–163. [DOI] [PubMed] [Google Scholar]
- 22. Sloan FA, Belsky D, Ruiz D, Lee P. Changes in incidence of diabetes mellitus–related eye disease among US elderly persons, 1994‐2005. Arch Ophthalmol 2008; 126: 1548–1553. [DOI] [PMC free article] [PubMed] [Google Scholar]
- 23. van der Heijden AAWA, Walraven I, van ‘t Riet E, Aspelund T, Lund SH, Elders P et al Validation of a model to estimate personalised screening frequency to monitor diabetic retinopathy. Diabetologia 2014; 57: 1332–1338. [DOI] [PubMed] [Google Scholar]
- 24. Leske MC, Wu SY, Hennis A, Nemesure B, Schachat AP, Hyman L et al Barbados Eye Study Group. Nine‐year incidence of diabetic retinopathy in the Barbados Eye Studies. Arch Ophthalmol 2006; 124: 250–255. [DOI] [PubMed] [Google Scholar]
- 25. Cikamatana L, Mitchell P, Rochtchina E, Foran S, Wang JJ. Five‐year incidence and progression of diabetic retinopathy in a defined older population: the Blue Mountains Eye Study. Eye 2007; 21: 465–471. [DOI] [PubMed] [Google Scholar]
- 26. Salinero‐Fort MÁ, San Andrés‐Rebollo FJ, de Burgos‐Lunar C, Arrieta‐Blanco FJ, Gómez‐Campelo P. Four‐year incidence of diabetic retinopathy in a Spanish Cohort: the MADIABETES study. PLoS One 2013; 8: e76417. [DOI] [PMC free article] [PubMed] [Google Scholar]
- 27. Martín‐Merino E, Fortuny J, Rivero‐Ferrer E, García‐Rodríguez LA. Incidence of retinal complications in a cohort of newly diagnosed diabetic patients. PLoS One 2014; 9: e100283. [DOI] [PMC free article] [PubMed] [Google Scholar]
- 28. Taylor‐Phillips S, Mistry H, Leslie R, Todkill D, Tsertsvadze A, Connock M et al Extending the diabetic retinopathy screening interval beyond 1 year: systematic review. Br J Ophthalmol 2016; 100: 105–114. [DOI] [PMC free article] [PubMed] [Google Scholar]
- 29. Echouffo‐Tcheugui JB, Ali MK, Roglic G, Hayward RA, Narayan KM. Screening intervals for diabetic retinopathy and incidence of visual loss: a systematic review. Diabet Med 2013; 30: 1272–1292. [DOI] [PubMed] [Google Scholar]
- 30. Scanlon PH. Screening intervals for diabetic retinopathy and implications for care. Curr Diab Rep 2017; 17: 96. [DOI] [PMC free article] [PubMed] [Google Scholar]
- 31. Scanlon PH, Aldington SJ, Leal J, Luengo‐Fernandez R, Oke J, Sivaprasad S et al Development of a cost‐effectiveness model for optimisation of the screening interval in diabetic retinopathy screening. Health Technol Assess 2015; 19: 1–116. [DOI] [PMC free article] [PubMed] [Google Scholar]
- 32. Sabanayagam C, Banu R, Chee ML, Lee R, Wang YX, Tan G et al Incidence and progression of diabetic retinopathy: a systematic review. Lancet Diabetes Endocrinol 2018; pii: S2213‐8587(18)30128‐1 10.1016/s2213-8587(18)30128-1. [Epub ahead of print] [DOI] [PubMed] [Google Scholar]
- 33. Sallam A, Scanlon PH, Stratton IM, Jones V, Martin CN, Brelen M et al Agreement and reasons for disagreement between photographic and hospital biomicroscopy grading of diabetic retinopathy. Diabet Med 2011; 28: 741–746. [DOI] [PubMed] [Google Scholar]
- 34. Benbassat J, Polak BCP. Reliability of screening methods for diabetic retinopathy. Diabet Med 2009; 26: 783–790. [DOI] [PubMed] [Google Scholar]
- 35. Goatman KA, Philip S, Fleming AD, Harvey RD, Swa KK, Styles C et al External quality assurance for image grading in the Scottish diabetic retinopathy screening programme. Diabet Med 2012; 29: 776–783. [DOI] [PubMed] [Google Scholar]