

Abstract
Understanding the relationship between molecular markers and a phenotype of interest is often obfuscated by patient-level heterogeneity. To address this challenge, Chang et al. recently published a novel method called Component-wise Sparse Mixture Regression (CSMR), a regression-based clustering method that promises to detect heterogeneous relationships between molecular markers and a phenotype of interest under high-dimensional settings. In this Letter to the Editor, we raise awareness to several issues concerning the assessment of CSMR in Chang et al., particularly its assessment in settings where the number of features, P, exceeds the study sample size, N, and advocate for additional metrics/approaches when assessing the performance of regression-based clustering methodologies.
Keywords: supervised learning, mixture modeling, disease heterogeneity
This journal recently published an article entitled, Supervised clustering of high dimensional data using regularized mixture modeling, in which Chang et al. [1] introduced a novel regression-based clustering method (RBCM) called Component-wise Sparse Mixture Regression (CSMR). CSMR is one of several recently proposed RBCMs [2, 3] whose purpose is to identify clusters or subpopulations that are defined based on differing relationships between a set of features (e.g., molecular markers) and some phenotype of interest (e.g., disease severity). Based on the assessments and performance metrics used in Chang et al.’s paper, CSMR was observed to outperform other RBCMs, including: Imputation Conditional Consistency (ICC) [2] and Finite Mixture Regression Selection (FMRS) [3]. Despite potential wide-ranging clinical/biological applications of CSMR, coupled with its strong performance across the various assessments/analyses conducted in Chang et al., our contention is that the assessments presented in Chang et al. fall short of providing a complete picture of the performance of CSMR, particularly in situations where the number of features is larger than the sample size (P > N, where P is the number of features and N the sample size). The purpose of this article is therefore to shed light on some of these issues and by doing so, advocate for additional metrics/approaches when assessing the performance of RCBMs.
Chang et al. [1] argue that CSMR can be used in high-dimensional situations by assuming a mixture of regression models that incorporate a Lasso penalty approximated by the least square method proposed by Wang et al. [4]. In doing so, CSMR performs variable selection by shrinking the regression coefficients of unimportant features to zero under the assumption of parsimony with respect to the number of features. To assess the performance of CSMR in high-dimensional settings, Chang et al. [1] conducted both simulation studies and an analysis of a Cancer Cell Line Encyclopedia (CCLE) data set [6] and benchmarked the performance of CSMR against: ICC [2], FMRS [3], Lasso ( penalized regression) [6], Ridge (
 penalized regression) [7] and Random Forests [8]. While only ICC and FMRS are bonafide RBCMs, the other methods, none of which explicitly account for patient-level heterogeneity in the same manner as the RCBMs, were included for the purpose of demonstrating that accounting for heterogeneity improves model performance. Chang et al. [1] assessed the clustering performance of CSMR under 12 different conditions (Table 1), and four different metrics were used to assess the performance of methods: (i) the correlation between predicted and observed response,
  , (ii) the true positive rate (TPR) of selecting features that were simulated to exhibit different relationships between the outcome across clusters, (iii) true negative rate (TNR) and (iv) the Rand Index (RI) between estimated and true cluster memberships. In addition to converging faster than ICC, CSMR exhibited the best performance with respect to the above metrics across the 12 simulation conditions listed in Table 1.
Table 1.
Simulation study parameters used in Chang et al. [1].  denotes the sample size,
  denotes the number of molecular features,
  denotes the number of clusters and σk denotes the assumed cluster-specific standard deviation of molecular features. For each cluster
  , features were simulated to have non-zero regression coefficient. Thus,
  represents the number of molecular features that exhibit differing relationships with the outcome/phenotype across the
  clusters
| Condition | N | P | K | σk | M0 |
|---|---|---|---|---|---|
| 1–3 | 200,300,400 | 100 | 2 | 1 | 5 |
| 4–6 | 400 | 100 | 2,3,4 | 1 | 5 |
| 7–9 | 400 | 100 | 2 | 0.5,1,2 | 5 |
| 10–12 | 400 | 100 | 2 | 1 | 5,8,20 |
The performance of CSMR was also assessed using the CCLE data set, which consists of 470 cell lines ( ), 7902 genes (
 ) and the cell line sensitivity score to 24 different drugs, as response variables. Because ‘true’ cluster membership, as well as the specific genes whose relationship with the sensitivity scores that define the clusters, is unknown, Chang et al. [1] used a 5-fold cross validated root mean squared error (RMSE), calculated by comparing the predicted and observed response in the withheld set, to assess the performance of CSMR and to benchmark its performance against other methods. In the CCLE data set, CSMR resulted in the lowest cross validated RMSE in 22 out of 24 drugs, far outperforming the other five methods.
Despite the strong performance of CSMR based on the assessments and metrics described above, the internal consistency (IC) of CSMR was not evaluated in Chang et al. [1]. In this context, IC refers to the similarity in clustering solutions when an algorithm/method is applied to the same data set under the same parameter settings (e.g. assumed number of clusters, K) [9]. Previous studies highlight the importance of IC when evaluating clustering methodologies [9–12], with unstable clustering output, or low IC, described as untrustworthy [13]. Since clustering is typically a means to an end and rarely an end in itself, with cluster membership assignments often forming the basis for downstream statistical analyses, methods with low IC have the potential to jeopardize the validity of any such downstream analysis involving clustering membership assignments. As a first step toward assessing the IC of CSMR, we computed the Adjusted Rand Index (ARI) between the cluster memberships obtained from h runs of CSMR on the same data set and under the same parameter settings for each run. While Chang et al. used RI in their simulation study for assessing the similarity between estimated cluster membership assignments and true cluster membership (hereafter, referred to as clustering accuracy), we believe that ARI [14], a measure of the similarity between two sets of cluster memberships corrected for chance, is a more appropriate measure of similarity compared with RI. ARI values near 0 indicate lack of agreement and values close to 1 indicate strong agreement between the two sets of cluster memberships. Indeed, many have advocated for the use of ARI over RI in assessing the similarity between two data clusters [15–18], and as such, the ARI has become a standard metric in performance evaluations of unsupervised clustering methods. In applying CSMR to the CCLE data set [1, 6], we found that repeated runs of CSMR on the same data set with the same tuning parameters (e.g. the same number of assumed clusters K) yielded drastically different results (Figure 1). Specifically, the median ARI between the  pairs of cluster memberships obtained from h = 100 applications of CSMR to the CCLE data set was 0.016 with the vast majority having ARI values <0.25 (Figure 1A). We next examined consistency in the specific genes that were selected/identified across the h = 100 applications of CSMR to the CCLE data set following the rationale that if there are indeed genes that exhibit a heterogenous relationship with the outcome, then one would expect those same genes to be selected in repeated applications of CSMR to the same data set. We observed that each iteration selected on average 43.6 out of 500 considered features (standard deviation = 11.7); however, only 8 features were selected by CSMR more than 60 times and 23 features selected more than 40 times (Figure 1B). The majority of features (362) were selected between 1 and 20 times, implying that the most selected features are not constant across CSMR runs.
Figure 1.
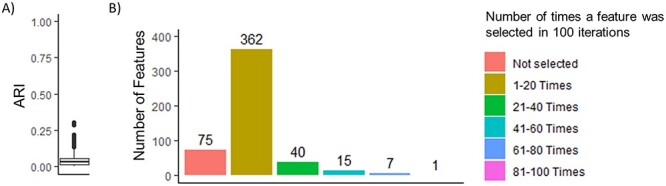
Performance of CSMR on the CCLE data set. (A) Boxplot of clustering IC, calculated as the ARI of cluster memberships between each pair of runs, from 100 separate applications of CSMR to the CCLE data set using the same tuning parameters for each run. (B) Bar plot of frequency of specific features being selected by CSMR from 100 separate applications of CSMR to the CCLE data set. Out of the 500 considered features, 425 features were selected by CSMR at least once. On average, CSMR selected 43.6 features each iteration (standard deviation = 11.7).
To further assess the IC of CSMR, we expanded the simulation study conducted by Chang et al. [1]. We used the same conditions as in Chang et al. [1] (Table 1) and generated data in the same way; however, we increased the number of features, P, from 100 to 500 in increments of 100, to gauge the performance of CSMR as a function of increasing data dimensionality. In addition to the four previously mentioned metrics used by Chang et al. [1], we assessed IC by computing the ARI between repeated runs of CSMR on the same simulated data set with the same tuning parameter values, whereas Chang et al. [1] only reported the accuracy of their method (e.g. RI between estimated and ‘true’ cluster membership). Similar to our analysis of the CCLE data set, we applied CSMR 100 times on the same simulated data set and computed the ARI between each pair of cluster memberships generated from the h = 100 runs. We observed that in general, as  increases, accuracy and IC decrease across all conditions (Table 2). When
  , mean model accuracy declined from 0.916 to 0.798, and mean IC from 0.980 to 0.730, as P is increased from 100 to 500. With P fixed, as
  is increased, we noticed a drastic decline in model performance (Figure 2). With the exception of
  , which resulted in overall strong performance as
  increased from 5 to 20, when
  is 200 or larger, clustering memberships generated from repeated runs of CSMR on the same data set have poor IC, along with poor-to-moderate accuracy, despite a very modest decrease in
  . To see if enlarged effect sizes of discriminatory features can offset the decline in model performance, we multiplied the coefficient matrix,
  , by
, by  , where L = 2 or 5. Our results showed that increasing
  does little to improve cluster performance, as the trend in poor IC and accuracy, when P is large and
  is increased, persists. Based on these results, we conclude that the favorable RMSE reported for CSMR in the CCLE analysis reported in Chang et al. [1] does not necessarily imply strong accuracy and consistency of cluster membership. Furthermore, as indicated by our analyses, there is a notable decline in the performance of CSMR in terms of both accuracy and IC when P > N and when
  is large, contradicting the general claim that CSMR is well-suited for high-dimensional settings. Similar results were obtained when K = 3. Regardless of K, we found that the accuracy and IC wane when P approaches N and M0 is large.
Table 2.
CSMR model performance in various simulation settings. K denotes the number of clusters, N denotes the sample size,  denotes the number of molecular features and L is a factor that scales the effect size of differentiating features. For each component
  where
where  , features were simulated to have non-zero regression coefficient. Thus,
  represents the number of molecular features that exhibit differing relationships with the outcome across the
  clusters.
  represents the correlation between predicted and observed response, TPR characterizes the rate at which the model selects features that were simulated to exhibit different relationships between the outcome across clusters, TNR is the proportion of features not identified by the model that were not simulated to exhibit different relationships between the outcome across clusters, accuracy is the measure of agreement between estimated and true cluster memberships and IC is a measure of similarity between repeated runs of CSMR on the same simulated data set, under the same parameter settings
| N | P | M 0 | L |
 *
*
|
TPR* | TNR* | Accuracy (RI)* | Accuracy (ARI)* | IC (RI)** | IC (ARI)** | |
|---|---|---|---|---|---|---|---|---|---|---|---|
| 2 | 400 | 100 | 5 | 1 | 0.993 | 1.000 | 0.993 | 0.916 | 0.832 | 0.990 | 0.980 |
| 2 | 400 | 200 | 5 | 1 | 0.991 | 0.998 | 0.999 | 0.841 | 0.682 | 0.978 | 0.956 |
| 2 | 400 | 300 | 5 | 1 | 0.994 | 0.999 | 0.995 | 0.878 | 0.756 | 0.964 | 0.928 |
| 2 | 400 | 400 | 5 | 1 | 0.988 | 0.977 | 0.994 | 0.862 | 0.724 | 0.912 | 0.823 |
| 2 | 400 | 500 | 5 | 1 | 0.984 | 0.957 | 0.992 | 0.798 | 0.596 | 0.865 | 0.730 |
| 2 | 400 | 100 | 10 | 1 | 0.995 | 0.995 | 0.994 | 0.916 | 0.831 | 0.979 | 0.957 |
| 2 | 400 | 200 | 10 | 1 | 0.978 | 0.903 | 0.972 | 0.845 | 0.690 | 0.801 | 0.603 |
| 2 | 400 | 300 | 10 | 1 | 0.975 | 0.892 | 0.983 | 0.865 | 0.730 | 0.873 | 0.746 |
| 2 | 400 | 400 | 10 | 1 | 0.972 | 0.861 | 0.972 | 0.751 | 0.503 | 0.698 | 0.397 |
| 2 | 400 | 500 | 10 | 1 | 0.983 | 0.923 | 0.990 | 0.794 | 0.588 | 0.826 | 0.651 |
| 2 | 400 | 100 | 20 | 1 | 0.990 | 0.958 | 0.975 | 0.892 | 0.784 | 0.877 | 0.754 |
| 2 | 400 | 200 | 20 | 1 | 0.963 | 0.773 | 0.908 | 0.631 | 0.263 | 0.592 | 0.185 |
| 2 | 400 | 300 | 20 | 1 | 0.946 | 0.599 | 0.904 | 0.521 | 0.008 | 0.506 | 0.010 |
| 2 | 400 | 400 | 20 | 1 | 0.954 | 0.611 | 0.933 | 0.538 | 0.076 | 0.525 | 0.049 |
| 2 | 400 | 500 | 20 | 1 | 0.947 | 0.571 | 0.943 | 0.530 | 0.060 | 0.513 | 0.025 |
| 2 | 400 | 100 | 20 | 2 | 0.991 | 0.966 | 0.969 | 0.917 | 0.832 | 0.876 | 0.751 |
| 2 | 400 | 200 | 20 | 2 | 0.964 | 0.769 | 0.908 | 0.637 | 0.317 | 0.627 | 0.176 |
| 2 | 400 | 300 | 20 | 2 | 0.945 | 0.607 | 0.911 | 0.527 | 0.054 | 0.508 | 0.015 |
| 2 | 400 | 400 | 20 | 2 | 0.954 | 0.628 | 0.938 | 0.561 | 0.121 | 0.532 | 0.064 |
| 2 | 400 | 500 | 20 | 2 | 0.949 | 0.575 | 0.946 | 0.532 | 0.077 | 0.517 | 0.034 |
| 2 | 400 | 100 | 20 | 5 | 0.993 | 0.975 | 0.974 | 0.906 | 0.811 | 0.901 | 0.801 |
| 2 | 400 | 200 | 20 | 5 | 0.963 | 0.785 | 0.921 | 0.661 | 0.321 | 0.601 | 0.201 |
| 2 | 400 | 300 | 20 | 5 | 0.945 | 0.605 | 0.910 | 0.525 | 0.050 | 0.509 | 0.015 |
| 2 | 400 | 400 | 20 | 5 | 0.955 | 0.632 | 0.936 | 0.556 | 0.112 | 0.526 | 0.050 |
| 2 | 400 | 500 | 20 | 5 | 0.947 | 0.564 | 0.949 | 0.532 | 0.0 | 0.519 | 0.037 |
| 3 | 400 | 100 | 5 | 1 | 0.993 | 0.984 | 0.918 | 0.848 | 0.658 | 0.893 | 0.762 |
| 3 | 400 | 200 | 5 | 1 | 0.987 | 0.941 | 0.924 | 0.730 | 0.397 | 0.795 | 0.619 |
| 3 | 400 | 300 | 5 | 1 | 0.985 | 0.875 | 0.866 | 0.658 | 0.237 | 0.627 | 0.172 |
| 3 | 400 | 400 | 5 | 1 | 0.986 | 0.931 | 0.892 | 0.659 | 0.238 | 0.623 | 0.163 |
| 3 | 400 | 500 | 5 | 1 | 0.984 | 0.755 | 0.876 | 0.567 | 0.034 | 0.553 | 0.006 |
| 3 | 400 | 100 | 10 | 1 | 0.972 | 0.787 | 0.881 | 0.690 | 0.309 | 0.653 | 0.228 |
| 3 | 400 | 200 | 10 | 1 | 0.980 | 0.745 | 0.816 | 0.651 | 0.226 | 0.623 | 0.173 |
| 3 | 400 | 300 | 10 | 1 | 0.981 | 0.611 | 0.827 | 0.557 | 0.012 | 0.551 | 0.008 |
| 3 | 400 | 400 | 10 | 1 | 0.979 | 0.570 | 0.855 | 0.557 | 0.014 | 0.548 | 0.001 |
| 3 | 400 | 500 | 10 | 1 | 0.983 | 0.505 | 0.883 | 0.554 | 0.005 | 0.550 | 0.002 |
| 3 | 400 | 100 | 20 | 1 | 0.968 | 0.520 | 0.762 | 0.562 | 0.024 | 0.556 | 0.021 |
| 3 | 400 | 200 | 20 | 1 | 0.979 | 0.549 | 0.754 | 0.553 | 0.005 | 0.554 | 0.005 |
| 3 | 400 | 300 | 20 | 1 | 0.987 | 0.461 | 0.815 | 0.554 | 0.002 | 0.553 | 0.002 |
| 3 | 400 | 400 | 20 | 1 | 0.979 | 0.427 | 0.849 | 0.554 | 0.003 | 0.551 | 0.002 |
| 3 | 400 | 500 | 20 | 1 | 0.979 | 0.332 | 0.893 | 0.553 | 0.002 | 0.553 | 0.001 |
*mean across 100 runs of CSMR on the same dataset
* *mean pairwise ARI of the 100 runs of CSMR on the same data set
Figure 2.

CSMR model performance in various simulation settings. Boxplots showing performance metric values when  . The x-axis shows
 at 100, 200 and 300, and the colors indicate
  . As
. As  and P increase, both accuracy and IC decline.
We believe that the reason for high instability in the results and thus low IC when  is large is due to the sparsity assumption and inherent bias of Lasso [19]. The CSMR method uses Lasso for variable selection and works well when the number of features that exhibit a differential association with the phenotype across clusters is low (e.g. small
 ). However, when the number differentiating features is large (e.g. large
 ), CSMR does not find all the differentiating features, reflected by the low TPR, and this may explain its low IC and correspondingly diminished accuracy in such situations.
In conclusion, while there is certainly merit to the CSMR method and evidence that, under certain scenarios, it can effectively recover subclusters that are driven by differing relationships between a set of features and some phenotype, our results show that its performance (accuracy and IC) wanes in high-dimensional settings when the number differentiating features is large. Thus, we encourage users interested in applying CSMR to first evaluate IC on their data. We further advocate for the use of IC as a performance metric in assessing the performance of unsupervised clustering methods and regression-based clustering methods alike.
Key Points
We raise awareness of shortcomings in both the performance metrics and assessments of Chang et al. regarding the CSMR method, a regression-based clustering method for identifying subgroups/clusters that are defined based on differing relationships between a set of molecular features and some phenotype of interest.
We show that the performance of CSMR, specifically its internal consistency (IC), becomes compromised in high dimensional settings (P > N); in particular, when the number of molecular features that define subgroup/cluster membership is large relative to the total number of molecular features used in clustering.
We advise users to examine IC when applying CSMR to their data set and advocate for the use of this metric when assessing and comparing regression-based clustering methods.
Bo Zhang is a graduate student at the Department of Biostatistics and Data Science, University of Kansas Medical Center. His research interests include machine learning and bioinformatics. His email is b021z055@kumc.edu.
Jianghua He is an Associate Professor at the Department of Biostatistics and Data Science, University of Kansas Medical Center. Dr He’s research interests include survival analysis, time-varying coefficient survival models and meta-analysis. Her email is jhe@kumc.edu.
Jinxiang Hu is an Assistant Professor at the Department of Biostatistics and Data Science, University of Kansas Medical Center. Dr Hu’s research interests include latent variable analysis and machine learning. Her email is jhu2@kumc.edu.
Devin C. Koestler is an Associate Professor at the Department of Biostatistics and Data Science, University of Kansas Medical Center. Dr Koestler’s research interests include methods development for high-dimensional omic data, statistical omics, unsupervised clustering, molecular epidemiology and epigenetics. His email is dkoestler@kumc.edu.
Prabhakar Chalise is an Associate Professor at the Department of Biostatistics and Data Science, University of Kansas Medical Center. Dr Chalise’s research interests include integrative methods development and application for omics data, integrative clustering, survival analysis and longitudinal data analysis. His email is pchalise@kumc.edu.
Contributor Information
Bo Zhang, Department of Biostatistics & Data Science, University of Kansas Medical Center, Kansas City, KS 66160, USA.
Jianghua He, Department of Biostatistics & Data Science, University of Kansas Medical Center, Kansas City, KS 66160, USA.
Jinxiang Hu, Department of Biostatistics & Data Science, University of Kansas Medical Center, Kansas City, KS 66160, USA.
Devin C Koestler, Department of Biostatistics & Data Science, University of Kansas Medical Center, Kansas City, KS 66160, USA.
Prabhakar Chalise, Department of Biostatistics & Data Science, University of Kansas Medical Center, Kansas City, KS 66160, USA.
Funding
Research reported was supported by the National Institute of Environmental Health Sciences (NIEHS) grant R01 ES025145; the National Cancer Institute (NCI) Cancer Center Support Grant P30 CA168524; the Kansas IDeA Network of Biomedical Research Excellence Bioinformatics Core, supported by the National Institute of General Medical Science award P20 GM103418; the Kansas Institute for Precision Medicine COBRE, supported by the National Institute of General Medical Science award P20 GM130423.
References
- 1. Chang W, Wan C, Zang Y, et al. Supervised clustering of high-dimensional data using regularized mixture modeling. Brief Bioinform 2020;22(4):1–11. [DOI] [PMC free article] [PubMed] [Google Scholar]
- 2. Li Q, Shi R, Liang F. Drug sensitivity prediction with high-dimensional mixture regression. PLoS One 2019;14(2):e0212108. [DOI] [PMC free article] [PubMed] [Google Scholar]
- 3. Khalili A, Chen J. Variable selection in finite mixture of regression models. J Am Stat Assoc 2007;102(479):1025–38. [Google Scholar]
- 4. Wang H, Leng C. Unified LASSO estimation by least squares approximation. J Am Stat Assoc 2007;102(479):1039–48. [Google Scholar]
- 5. Barretina J, Caponigro G, Stransky N, et al. The cancer cell line encyclopedia enables predictive modelling of anticancer drug sensitivity. Nature 2012;483(7391):603–7. [DOI] [PMC free article] [PubMed] [Google Scholar]
- 6. Tibshirani R. Regression shrinkage and selection via the Lasso. J R Stat Soc B Methodol 1996;58(1):267–88. [Google Scholar]
- 7. Hoerl AE, Kennard RW. Ridge regression: biased estimation for nonorthogonal problems. Dent Tech 1970;12(1):55–67. [Google Scholar]
- 8. Breiman L. Random forests. Mach Learn 2001;45(1):5–32. [Google Scholar]
- 9. Lisboa PJ, Etchells TA, Jarman IH, et al. Finding reproducible cluster partitions for the k-means algorithm. BMC Bioinform 2013;14(Suppl 1):S8. [DOI] [PMC free article] [PubMed] [Google Scholar]
- 10. Hassani M, Seidl T. Using internal evaluation measures to validate the quality of diverse stream clustering algorithms. Vietnam J Comput Sci 2017;4(3):171–83. [Google Scholar]
- 11. Lange T, Roth V, Braun ML, et al. Stability-based validation of clustering solutions. Neural Comput 2004;16(6):1299–323. [DOI] [PubMed] [Google Scholar]
- 12. Sauvageot N, Schritz A, Leite S, et al. Stability-based validation of dietary patterns obtained by cluster analysis. Nutr J 2017;16(1):4. [DOI] [PMC free article] [PubMed] [Google Scholar]
- 13. Goldenberg A. A survey of statistical network models. Foundations and trends®. Mach Learn 2009;2(3):235–74. [Google Scholar]
- 14. Hubert L, Arabie P. Comparing partitions. J Classif 1985;2(1):193–218. [Google Scholar]
- 15. Milligan GW, Cooper MC. A study of the comparability of external criteria for hierarchical cluster analysis. Multivar Behav Res 1986;21(4):441–58. [DOI] [PubMed] [Google Scholar]
- 16. Dreger RM. Microcomputer programs for the Rand index of cluster similarity. Educ Psychol Meas 1986;46(3):655–61. [Google Scholar]
- 17. Santos JM, Embrechts M. On the use of the adjusted Rand index as a metric for evaluating supervised classification. In: Artificial Neural Networks – ICANN 2009. Berlin, Heidelberg: Springer Berlin Heidelberg, 2009. [Google Scholar]
- 18. Albatineh AN, Niewiadomska-Bugaj M, Mihalko D. On similarity indices and correction for chance agreement. J Classif 2006;23(2):301–13. [Google Scholar]
- 19. Zhang C-H, Huang J. The sparsity and bias of the Lasso selection in high-dimensional linear regression. Ann Stat 2008;36(4):1567–94. [Google Scholar]