

Abstract
Inactive state-selective KRAS(G12C) inhibitors1–8 demonstrate a 30–40% response rate and a ~6 month median progression-free survival in patients with lung cancer9. The genetic basis for resistance to these first-in-class mutant GTPase inhibitors remains under investigation. Here we evaluated matched pre- and post-treatment specimens from 43 patients treated with the KRAS(G12C) inhibitor sotorasib. Multiple treatment-emergent alterations were observed across 27 patients, including alterations in KRAS, NRAS, BRAF, EGFR, FGFR2, MYC and other genes. In preclinical patient-derived xenograft and cell line models, resistance to KRAS(G12C) inhibition was associated with low allele frequency hotspot mutations in KRAS(G12V or G13D), NRAS(Q61K or G13R), MRAS(Q71R) and/or BRAF(G596R), mirroring observations in patients. Single-cell sequencing in an isogenic lineage identified secondary RAS and/or BRAF mutations in the same cells as KRAS(G12C), where they bypassed inhibition without affecting target inactivation. Genetic or pharmacologic targeting of ERK-signaling intermediates enhanced the antiproliferative effect of G12Ci-treatment in models with acquired RAS or BRAF mutations. Our study thus suggests a heterogenous pattern of resistance with multiple subclonal events emerging with G12Ci-treatment. A subset of patients in our cohort acquired oncogenic KRAS, NRAS or BRAF mutations and resistance in this setting may be delayed by co-targeting of ERK-signaling intermediates. These findings merit broader evaluation in prospective clinical trials.
KRAS mutations are among the most frequent alterations found in cancer and, until recently, they were considered undruggable. KRAS and the highly-related NRAS and HRAS GTPases function as a molecular switches10,11, cycling between an active and an inactive conformation. Cancer-hotspot mutations occurring at codons 12, 13 and 61 hyperactivate downstream signaling, including the pathway mediated by RAF, MEK and ERK kinases12.
Recent advances have led to inhibitors targeting KRAS(G12C)1–6, the most common KRAS mutation in lung cancer13,14. KRAS(G12C) inhibitors (G12Ci), like sotorasib and adagrasib, trap the oncoprotein in an inactive state by suppressing the reactivation by nucleotide-exchange2,3,7. Sotorasib demonstrates a 32–37% response rate in lung cancer patients, with a median progression-free survival of ~6 months9. Preliminary reports suggest a similar clinical benefit from adagrasib15.
To gain insight into the genetic basis of resistance, we evaluated paired liquid and/or tissue biopsies from 43 patients treated with sotorasib. Thirty-six (36) patients had non-small cell lung cancer (NSCLC), 3 patients had colorectal cancer (CRC) and 4 had other cancers (melanoma, pancreatic cancer, small cell lung cancer or spindle cell carcinoma). The magnitude of response and the duration of therapy are shown in Table 1. Eight lung cancer patients had an exceptional response to treatment, defined as a complete or a long-term partial response lasting more than 12 months (CR/LTR). Four patients remained on therapy at the time of submission.
Table 1.
Patient characteristics and alterations associated with sotorasib treatment
| Pt | Cancer | % | mo1 | Treatment-associated alterations (VAF or estimated copies)2 | Samples |
|---|---|---|---|---|---|
| 16 | NSCLC | −100% | 18* | treatment ongoing | pre: cfDNA |
| 26 | NSCLC | −100% | 21* | treatment ongoing | pre: cfDNA |
| 36 | NSCLC | −87% | 6.6 | BRAFK601E (0.2%) | cfDNA/cfDNA |
| 37 | NSCLC | −83% | 8.2 | KRASamp (5) | cfDNA/cfDNA |
| 43 | NSCLC | −76% | 12.6* | none emerging | cfDNA/cfDNA |
| 39 | NSCLC | −68% | 20.4* | KRASV14I (0.5%, unchanged v. baseline), undetectable KRASG12C | cfDNA/cfDNA |
| 51 | NSCLC | −53% | 3.9 | PTENF200S (0.2%) | cfDNA/cfDNA |
| 10 | Melanoma | −49% | 7.1 | NRASQ61L (3%) | cfDNA/tissue |
| 49 | NSCLC | −48% | 3.7 | METamp (5.3), RICTORamp (7.4) | cfDNA/cfDNA |
| 19 | NSCLC | −46% | 9.8 | IDH1R132C (20%), TP53Q144* (27%) | tissue/tissue |
| 3 | NSCLC | −45% | 3.5 | MYCamp (7.2), APCA1002G (0.4%) | tissue/cfDNA |
| 4 | NSCLC | −43% | 5.6 | none emerging | cfDNA/tissue |
| 46 | NSCLC | −42% | 2.8 | none emerging | cfDNA/cfDNA |
| 18 | NSCLC | −42% | 18* | treatment ongoing | pre: cfDNA |
| 23 | NSCLC | −40% | 18* | treatment ongoing | pre: cfDNA |
| 52 | NSCLC | −36% | 3.1 | EGFRS1064R (0.5%), MYCamp (56, up from 23 at baseline) | cfDNA/cfDNA |
| 33 | NSCLC | −36% | 3.2 | KRASamp (4.6) | cfDNA/cfDNA |
| 11 | NSCLC | −36% | 17* | KRASV8L (0.3%) | cfDNA/cfDNA |
| 48 | NSCLC | −34% | 2.1 | PTENP339A (0.15%, up 3-fold v. baseline), PTENdel | cfDNA/cfDNA |
| 42 | NSCLC | −33% | 2.8 | none emerging | cfDNA/cfDNA |
| 25 | NSCLC | −32% | 18* | FGFR2A68T (0.15%), undetectable KRASG12C | tissue/cfDNA |
| 41 | NSCLC | −26% | 5.1 | NRASG13V (0.4%, up 3-fold v. baseline) | cfDNA/cfDNA |
| 44 | NSCLC | −19% | 8.4 | EGFRP1108L (0.2%), KEAP1V42L (0.3%), TP53G105C (0.9%) | cfDNA/cfDNA |
| 6 | NSCLC | −14% | 4.9 | FGFR2D304N (0.3%) | tissue/cfDNA |
| 20 | CRC | −14% | 2.8 | none emerging | tissue/tissue |
| 2 | NSCLC | −13% | 4.2 | BRAFK601E (0.13%), PTCH1E1257K (0.18%) | tissue/cfDNA |
| 50 | NSCLC | −12% | 5.9 | METamp (3.6), EGFRamp (3.6) | cfDNA/cfDNA |
| 17 | NSCLC | −11% | 4 | none emerging, NF1A26465S (0.6%) at baseline | tissue/cfDNA |
| 35 | NSCLC | −7% | 4.9 | KRASamp (3.4), PIK3CAH1047R (0.3%) | cfDNA/cfDNA |
| 24 | NSCLC | −6% | 5 | RB1L60Ffs*50 (2%) | tissue/cfDNA |
| 45 | NSCLC | −5% | 7.6 | FGFR2amp (4.7) | cfDNA/cfDNA |
| 40 | NSCLC | 2% | 6.3 | KRASG12F (0.4%), undetectable KRASG12C | cfDNA/cfDNA |
| 34 | NSCLC | 2% | 2.8 | KRASG12V (4%, up 5-fold v. baseline), undetectable KRASG12C | cfDNA/cfDNA |
| 22 | CRC | 2% | 2.8 | none emerging | tissue/cfDNA |
| 14 | Pancreas | 2% | 3.3 | BRAFG596C (0.1%), undetectable KRASG12C | cfDNA/cfDNA |
| 38 | NSCLC | 8% | 2.8 | KRASG12D (0.2%, up 3-fold v. baseline), undetectable KRASG12C | cfDNA/cfDNA |
| 9 | CRC | 15% | 1.4 | none emerging, KRASQ61H (0.2%) at baseline | cfDNA/cfDNA |
| 1 | NSCLC | 16% | 2.4 | APCP1001S (0.71%), SMARCA4R181Kfs*106 (1.5%) | cfDNA/tissue |
| 8 | Spindle Cell | 30% | 1.2 | none emerging | cfDNA/cfDNA |
| 5 | NSCLC | 31% | 1.2 | none emerging, CDKN2A/Bhomdel at baseline | tissue/cfDNA |
| 21 | SCLC | 58% | 1.4 | NF1N1004Ifs*8 (0.3%), MYCamp (3.5) | cfDNA/cfDNA |
| 7 | NSCLC3 | 62% | 1.3 | NRASG13V (1.2%), IDH2R172S (20%), CTNNB1D546G (19%) | cfDNA/tissue |
| 12 | NSCLC | NA | 0.6 | none emerging; CDKN2A/Bhomdel at baseline | tissue/cfDNA |
The asterisk denotes exceptional responders; Pt: patient; %: response by RECIST criteria; mo: months on treatment; NSCLC: non-small cell lung cancer; CRC: colorectal cancer
If an alteration was detected at baseline, the fold change in VAF relative to baseline is shown.
Pt. 7 had a near complete response in a CNS lesion along with systemic progressive disease.
Although no significant differences in baseline alterations were identified between exceptional responders and the rest of the cohort (Extended Data Fig.1a), the former had a lower plasma KRAS(G12C) allele frequency (Extended Data Fig. 1b and c) and a lower tumor burden (Extended Data Fig. 1d) at baseline. A subset of patients, for whom both archival/baseline tissue and baseline cell-free DNA (cfDNA) were available for comparison, revealed no significant difference in intratumoral KRAS(G12C) allele frequency between the groups (Extended Data Fig. 1c). The data raise the possibility that the pre-treatment tumor burden and the propensity to detect KRAS(G12C) in circulation may predict for exceptional response to sotorasib treatment in lung cancer patients. Better powered analyses are needed to further explore these trends in prospective studies.
Multiple treatment-emergent alterations were identified in 27/43 patients (Fig. 1a, b and Table 1). Emergent alterations in the highly homologous KRAS or NRAS GTPases, hereafter referred to as secondary (2o) RAS, were detected in several patients (Table 1 and Fig. 1c). These included 4 patients with another KRAS mutation (G12D, G12V, G12F, V8L), 3 patients with a low-level KRAS copy number gain (estimated copies of 3.4–5 by cfDNA) and 3 patients with NRAS mutations (Q61L, G13V). Non-V600E BRAF mutations (K601E, G596C) were found in 3 patients. Other events included alterations in EGFR (amplification, P1108L, S1046R), FGFR2 (amplification, A68T, D304N), MET (amplification), MYC (amplification), IDH1/2 (R132C, R172S) and others (Fig. 1a and Table 1). The KRAS(G12C) allele was undetectable by cfDNA analysis in 6 patients. Most treatment-emergent variants were found to have a low allele frequency, which likely reflects the fact that most patients were evaluated by cfDNA sequencing.
Figure 1. Genetic alterations associated with resistance to sotorasib treatment.
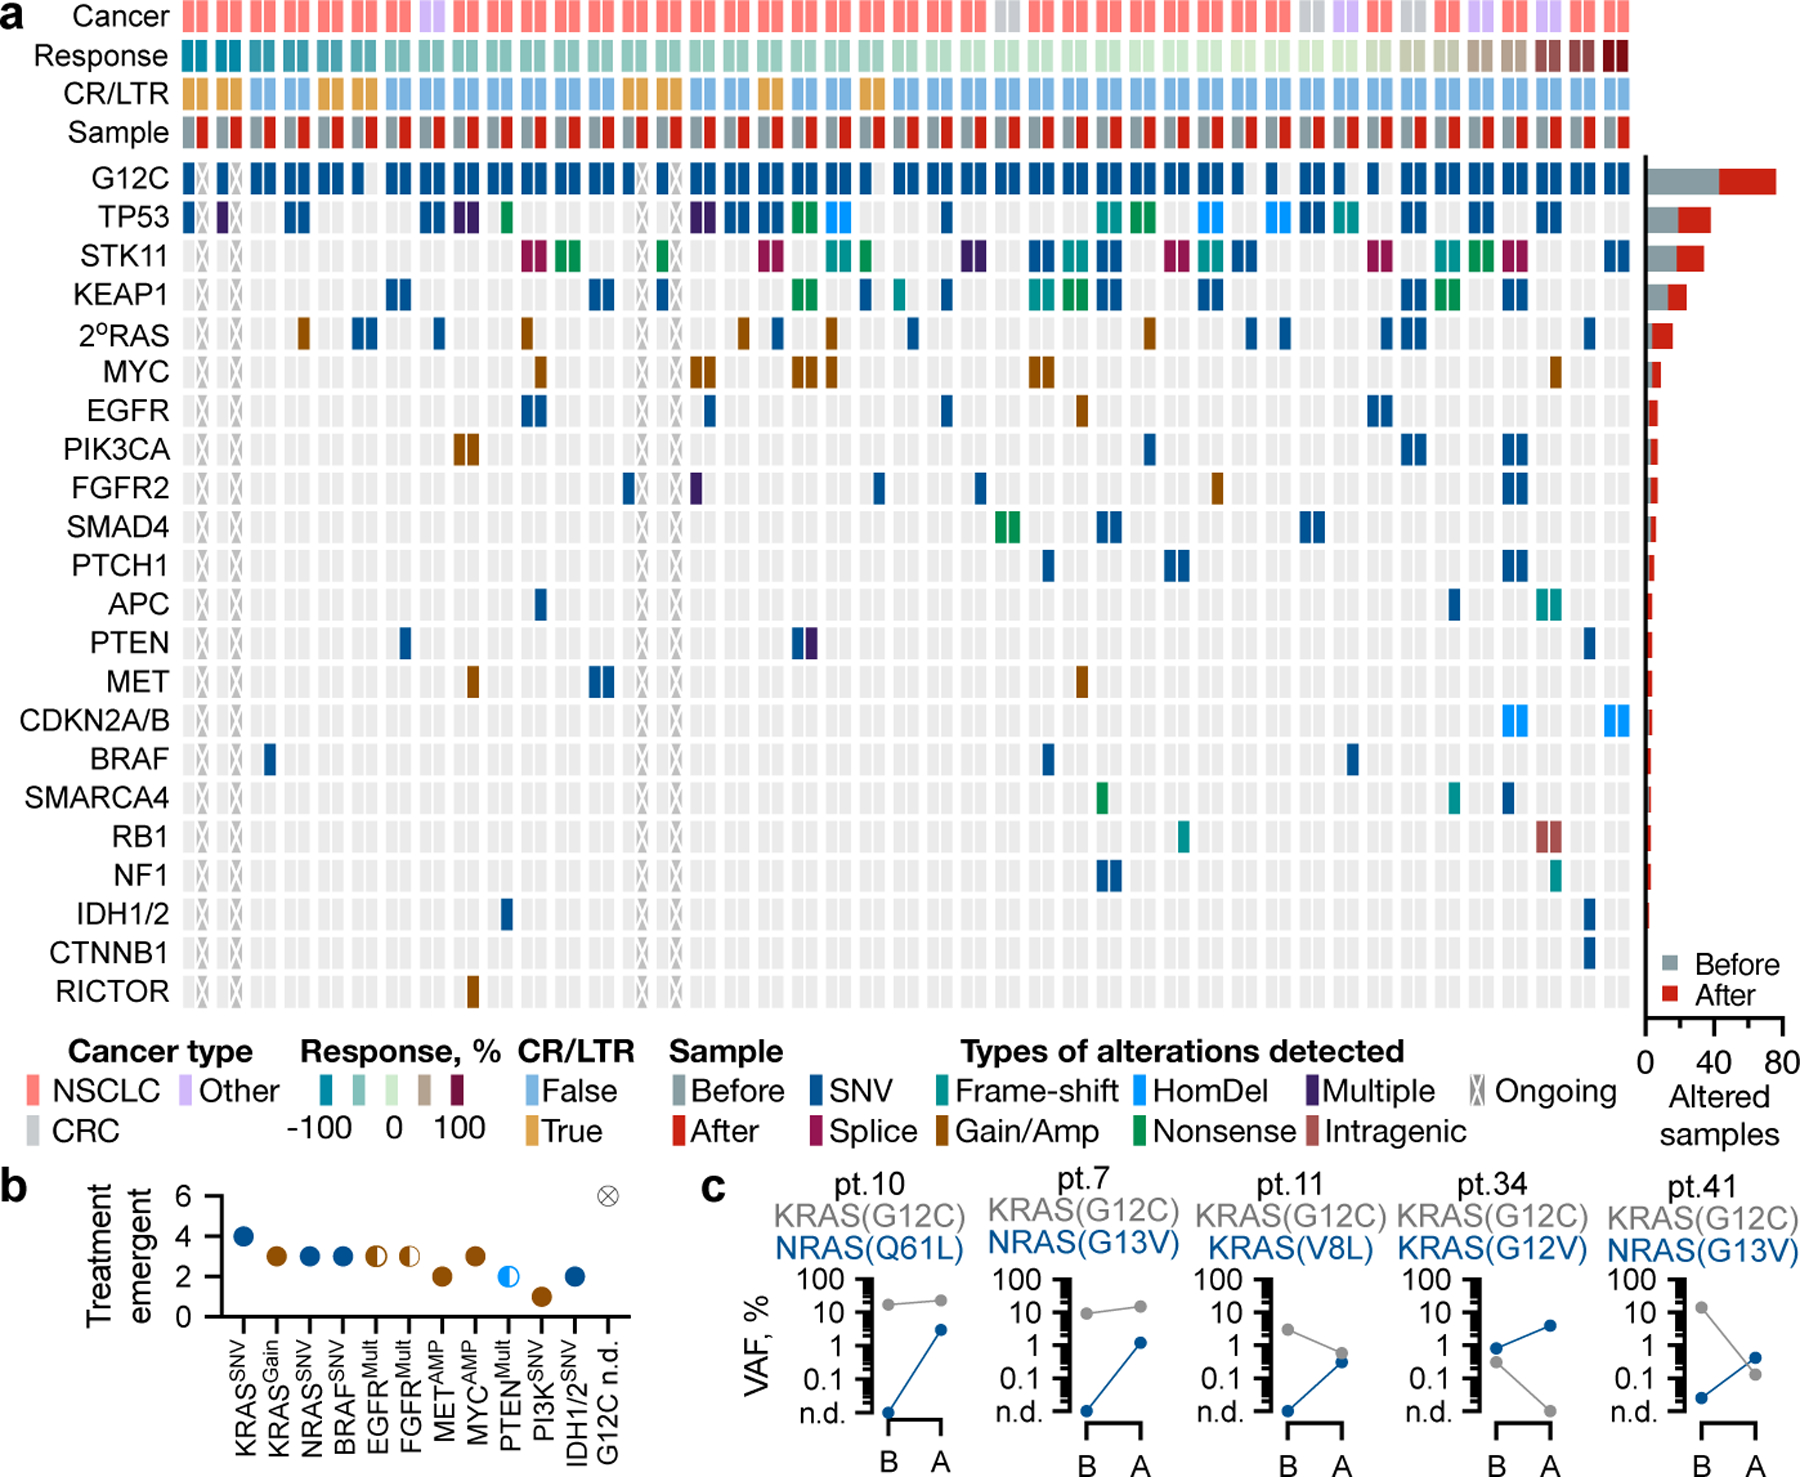
a, Heatmap of baseline and treatment-emergent alterations. b, The number of emergent alterations in the indicated genes. c, Allele frequencies for the indicated variants before (B) and after (A) treatment. n.d.: not detected; mult: multiple.
Low-frequency variants identified in an isolated patient are unlikely to drive resistance. If, however, they recur across patients and/or experimental systems, they may be sufficient for resistance. To gain more insight into this possibility, mice bearing lung or colorectal cancer patient-derived xenografts (PDX) were treated with vehicle or G12Ci (Extended Data Fig. 2a and b) followed by DNA sequencing. Treatment-emergent alterations included KRAS(G13D) and BRAF(S147N), detected in Lu3 and Lu36, respectively (Fig. 2a and Extended Data Fig. 2c). Even in the PDX panel, 2oRAS/BRAF mutations appeared subclonal based on their low variant allele frequency (VAF) (Fig. 2b and Extended Data Fig. 2c). Moreover, KRAS amplification was present at baseline in models with a weaker response to treatment (Co1, Lu36 and Lu69, Extended Data Fig. 2d).
Figure 2. Treatment-emergent alterations in pre-clinical models.

a, Heatmap of notable alterations in vehicle or G12Ci-treated PDX models. b, VAFs of the indicated variants in Lu3. c, Single-cell and bulk DNA sequencing in parental and resistant cells. The number of single cells harboring the indicated alterations (top), as well as their VAFs by scDNA and bulk DNA sequencing (right) are shown. d, The composition of parental and resistant models. *: MRAS was not part of the single-cell sequencing panel, and its frequency was estimated through bulk sequencing.
We next established isogenic lineages with acquired resistance to G12Ci-treatment (Extended Data Fig. 3a). H358 derivatives 1M, R1 and R2 had little, if any, sensitivity to treatment with several G12Ci, including sotorasib, adagrasib and MRTX1257 (Extended Data Fig. 3b–e). When exposed to sotorasib, resistant cells showed little inhibition of downstream signaling or induction of cleaved PARP (Extended Data Fig. 3f and g), a known marker of drug-induced apoptosis4,6,16. However, the level of active KRAS was suppressed by the drug (albeit less so in 1M cells).
Single-cell DNA sequencing of the H358 lineage identified NRAS(Q61K), KRAS(G12V), BRAF(G596R) and NRAS(G13R) mutations in resistant but not in parental cells (Fig. 2c, top bars), an observation that was validated by bulk sequencing (Fig. 2c, right bars) and one that is concordant with the clinical and PDX data presented above. At the time of single-cell sequencing, the KRAS(G12V) and BRAF(G596R) variants were found in subpopulations of 1M cells, NRAS(Q61K) was detected in most R1 and in some R2 cells, whereas NRAS(G13R) was detected in a small proportion of the R2 population (Fig. 2d). Most frequently, these alterations were found to co-occur with KRAS(G12C); although rare cells (~0.1%) harboring KRAS(G12V) or NRAS(Q61K) without detectable KRAS(G12C) were also identified (Fig. 2c and Extended Data Fig. 4a, b).
To account for alterations in genes missing from the targeted sequencing panels used above, we also performed whole-exome sequencing in R1 and R2 models, a process that identified MRAS(Q71R) with a variant allele frequency of ~3% in the R2 population. The presence of the MRAS mutation was validated by independent targeted sequencing. MRAS is a small GTPase in the RAS superfamily that forms a complex with the adaptor SHOC2 and the phosphatase PP1 to regulate CRAF dimerization and activation17,18.
To estimate the prevalence of 2oRAS mutations in the absence of KRAS-directed therapy we turned to a cohort of 8,750 KRAS-mutant tumors (from 7,790 patients treated at MSK) and identified 304 specimens (from 263 patients) with multiple RAS mutations (Extended Data Fig. 5a). These included associations between RAS oncogenes mutated at G12, G13 or Q61 (Extended Data Fig. 5b). Among KRAS(G12C)-mutant specimens, 40/1,432 (~3%) had a 2oRAS variant (Extended Data Fig. 5c and d). With these in mind, the number of treatment-emergent 2oRAS mutations in patients (7/43 patients or 16%), and in preclinical models (2/9 models or 22%), suggest a several-fold increase by G12Ci-treatment relative to the untreated population.
Considering their suspected subclonal nature, we next asked if 2oRAS mutations are sufficient for G12Ci-resistance. Drug-sensitive H358 cells were engineered to express such mutants under a doxycycline (dox)-inducible promoter. Dox-induced expression of KRAS(G12V), NRAS(Q61K) or MRAS(Q71R) attenuated the inhibition of downstream signaling by the inhibitor, without a notable effect on the level of endogenous KRAS activation (Extended Data Fig. 6a). As expected, expression of the secondary GTPase attenuated the antiproliferative effects of either sotorasib or adagrasib (Extended Data Fig. 6b–d); an attenuation evident even at a low-level of 2oRAS expression (0.02 µg/mL dox). Thus, hotspot mutations in RAS family GTPases have a strong propensity to bypass KRAS(G12C) inhibition without affecting target engagement by the drug. In a similar manner, dox-inducible expression of the low-kinase activity (class 3) BRAF mutant G596R in H358 cells attenuated inhibition by either sotorasib or adagrasib (Extended Data Fig. 6e). Other alterations, such as IDH1, KEAP1 and STK11, had only modest effects when independently evaluated in H358 cells (Extended Data Fig. 6f and g).
In the process of selecting for H358 drug-resistant derivatives we isolated sequential cell populations (passages) with a progressive attenuation in the magnitude and duration of ERK inhibition, coupled with a diminished cleaved PARP levels (Extended Data Fig. 7a and b). These changes are consistent with intermediate cell states in the evolutionary process leading to resistance. When subjected to bulk sequencing to determine the temporal association of treatment-emerging RAS/BRAF alterations, the sequential passages revealed both patterns of clonal dominance and dynamic fluctuations in the frequency of the variant alleles over time (Fig. 3a). The former was evidenced by a sweeping expansion of the NRAS(Q61K) mutation along the R1 series. The latter was apparent in 1M passages, where an early co-occurrence of KRAS(G12V) and BRAF(G596R) mutations was followed by attrition of the BRAF variant. Similarly, MRAS(Q71R) was an early event associated with resistance in the R2 lineage that was subsequently outcompeted by emerging NRAS(Q61K) or NRAS(G13R) mutations. The allele frequency of KRAS(G12V) and NRAS(Q61K or G13R) mutations rose with prolonged drug selection, even after the population became resistant to treatment (dotted lines in Fig. 3a).
Figure 3. Temporal tracking of treatment-emergent alterations.

a, The allele frequency of RAS/BRAF variants in intermediate passages from the resistant lineages shown. b-c, Unlabeled parental (H358) cells and BFP-labeled derivatives expressing dox-inducible NRAS(Q61K) were co-cultured in the presence of dox and sotorasib for 72h to determine the distribution of subpopulations (b) by FACS (n=20,000 independent single cells) and the effect of the minor 2oNRAS subclone on the major parental subpopulation (c). A representative of three independent experiments is shown in b and c.
To test the possibility that even minor 2oRAS-mutant subclones can attenuate inhibition, KRAS(G12C) mutant H358 cells with dox-inducible NRAS(Q61K) expression were co-cultured with their parental H358 cells in the presence of sotorasib treatment for 72h. Doxycycline-treatment was used to selectively induce the expression of mutant NRAS in the minor subclone. The antiproliferative effect of treatment was progressively attenuated as the 2oNRAS mutant subclone frequency rose from 1% to 33% (Extended Data Fig. 7c). No attenuation of inhibition was observed in the absence of dox-stimulation (Extended Data Fig. 7d). Moreover, even the proportion of live parental cells after treatment increased as a function of the 2oNRAS subclone (Fig. 3b, c and Extended Data Fig. 7e–f).
To identify selective therapeutic vulnerabilities in G12Ci-resistant tumors, we carried out CRISPR/CAS9 screens in KRAS(G12C)/NRAS(Q61K)-mutant (R1) and parental KRAS(G12C)-mutant (H358) cells (see methods). The screen identified sgRNAs targeting several ERK-signaling intermediates, including SHOC2, ERK2, NRAS, CRAF and BRAF, as being depleted with sotorasib relative to DMSO in resistant cells but not in parental cells (Fig. 4a and Extended Data Fig. 8a). sgRNAs targeting SHOC2 were independently expressed in R1 and R2 cells and led to a more pronounced signaling inhibition and antiproliferative effect following G12Ci-treatment (Extended Data Fig. 8b–f). In addition, siRNA-mediated knockdown of NRAS in R1 cells also led to a more durable inhibition of pERK (Extended Data Fig. 8g) and proliferation (Extended Data Fig. 8h) by sotorasib, confirming the results from the genetic depletion screen.
Figure 4. Effect of co-targeting ERK-signaling intermediates.

a, Genome-wide sgRNA screens in sotorasib-resistant (R1) and parental (H358) cells. b, Xenograft-bearing mice were treated as shown to determine the effect on tumor growth (each biological replicate along with the mean ± s.e.m are plotted, two tailed t-test p values are shown).
Considering the other hits from the screen, and the absence of SHOC2- or NRAS-directed therapies, we evaluated the effect of RAF dimer (LXH254), MEK (trametinib) or ERK (SCH984) inhibitors on restoring G12Ci-sensitivity in resistant models. Combined treatment of resistant cells with sotorasib and trametinib led to a more durable ERK signaling inhibition, as compared to each drug alone (Extended Data Fig. 9a). A similar effect was observed with the sotorasib/LXH254 combination (Extended Data Fig. 9b).
Treatment with each of the noted combinations led to a more pronounced antiproliferative effect in 1M, R1 and R2 resistant derivatives (Extended Data Fig. 9c) or in H358 cells with dox-inducible expression of 2oRAS or BRAF variants (Extended Data Fig. 9d–f). By comparison, the combinations had little added effect in the absence of such secondary mutations. The sotorasib/trametinib combination was more effective at suppressing tumor growth in mice bearing cell line or patient-derived xenografts as compared to single-agent treatment with either drug (Fig. 4b and Extended Data Fig. 10a and b).
Here we report genetic alterations associated with resistance to KRAS(G12C) inhibition in the clinical and preclinical settings. The data suggest a heterogenous pattern of resistance with what appear to be multiple subclonal alterations emerging after treatment. A subset of patients had emergent hotspot mutations in KRAS, NRAS or BRAF; a finding that was pervasive across PDX and cell line models. Oncogenic 2oRAS mutations bypass KRAS(G12C) inhibition and drive resistance by reactivating ERK signaling. The data also support the possibility that minor subclones harboring such mutations help attenuate inhibition across a broader cancer cell population. Sampling bias and other limitations associated with cfDNA analysis may also contribute to the low-variant allele frequencies. Future studies aiming at multifocal, tissue-based, assessment of progressive disease are needed to gain more insight on the emergence/evolution of G12Ci resistance.
The lack of a dominant resistance alteration poses a challenge in determining an all-inclusive treatment strategy for patients who progress on G12Ci monotherapy. If druggable, treatment-emergent variants can inform the choice of downstream therapy. Our data suggest that co-targeting ERK-signaling intermediates alongside KRAS(G12C) may prolong the benefit of therapy in the setting of emergent hotspot mutations in RAS or BRAF. It is unlikely that these combinations will be effective for all acquired or adaptive resistance mechanisms and this possibility was not experimentally tested in our study. Biomarker-driven prospective clinical studies are needed to determine optimal therapeutic strategies in patients who progress on G12Ci-monotherapy.
Methods:
No statistical methods were used to predetermine sample size. The experiments were not randomized and, unless otherwise indicated, the investigators were not blinded to allocation during experiments and outcome assessment.
Patient specimens
Patients were eligible if they were treated with sotorasib (clinical trial: NCT03600883, NCT04185883). Most post-treatment specimens were obtained through liquid biopsies. Tissue biopsies were available only in six patients (Supplementary Data 1). Targeted next-generation sequencing of clinical specimens was carried out independently of this study as part of routine clinical assessment with established point-of-care assays: Resolution Biosciences or MSK-ACCESS for liquid biopsies and MSK-IMPACT for tissue biopsies. Alterations in genes outside of these targeted panels could not be assessed. The data was collected through chart review or clinical trial repository. Where indicated, the sequencing data were manually curated to evaluate the presence of secondary RAS mutations below the assay’s reporting threshold. Treatment-emergent variants were defined as those detected only after exposure to therapy or those enriched after treatment (i.e., an increase in variant allele frequency of 3-fold or more). Amplifications were included if the estimated copy number was reported to be greater than 3. Fold changes can be unreliable for these mostly non-quantitative cfDNA assays, where quantitation limits are not established. Both the post-treatment VAF, as well as the fold change relative to the pre-treatment are reported.
Patient-derived xenograft (PDX) models.
Clinical specimens were collected and analyzed using protocols: 06–107, 12–245, 20–059 all approved by the Memorial Sloan Kettering Cancer Center (MSKCC) Institutional Review Board (IRB), with informed consent obtained in all cases. Mouse studies were carried out following the protocols approved by the MSKCC Institutional Animal Care and Use Committee (IACUC). To generate the PDX models, cell suspensions isolated from tissue or pleural fluid were mixed with matrigel (BD Biosciences) and injected subcutaneously in the flanks of immunodeficient NSG mice and monitored for tumor growth. To determine the sensitivity to G12Ci treatment, mice bearing of PDX tumors were treated with either sotorasib (100 milligram (mg) per kilogram (kg) body weight), MRTX1257 (50 mg/kg) or adagrasib (100 mg/kg) or vehicle for five days a week. MRTX1257 is a more potent analogue of adagrasib. Treatment was started once the tumors reached a volume of 100 mm3 and tumor growth was monitored twice a week.
Cell culture and reagents
The cell lines used in the study were maintained in DMEM medium supplemented with 10% FBS, penicillin, streptomycin and 2 mM L-glutamine. H358 cells were obtained from ATCC (CRL-5807), confirmed by STR profiling and tested negative for mycoplasma. H358 STK11 KO and H358 KEAP1-KO cells were gifts from Charles Rudin. Sotorasib was obtained from Amgen and administered at a concentration of 1 μM or as otherwise specified in cell culture and at a dose of 100 mg/kg in mice. Adagrasib and MRTX1257 were obtained from Mirati and administered at 100 nM or as otherwise specified in cell culture and at a dose of 100 mpk and 50 mpk in mice, respectively. Trametinib was obtained from DC Chemicals and administered at 50 nM or otherwise specified in culture and at a dose of 1 mpk in xenograft studies. The RAF dimer inhibitor (LXH254) was obtained from Novartis and administered at 2 μM in cell culture and 50 mpk in xenograft studies. The ERK inhibitor (SCH772984, aka SCH984) was obtained from Selleckchem and used at 500 nM in cell culture.
Cloning and plasmids
KRAS, NRAS, MRAS in pENTR/D-TOPO vector (Invitrogen) were used as templates to generate KRAS(G12V), NRAS(Q61K) and MRAS(Q71R) respectively with QuickChange II site-directed mutagenesis kit (Agilent, #200523). To generate doxycycline inducible constructs, the mutants were cloned into the pInducer20 vector (Addgene #44012) using Gateway LR Clonase kit (Thermo Fisher, #11791019). sgRNA targeting SHOC2 (guide1: 5’- TCATACCTATAGTATCTGGG-3’; guide2: 5’- TAGTTATACGATTAAAGCGA-3’) were cloned into lentiCRISPRv2 plasmid (Addgene plasmid #52961) via the BsmBI site. BRAF in pDOR223 (addgene #81684) were used as template to generate BRAF(G596R) with mutagenesis kit (Agilent, #200523). pDOR223-IDH1(L302C) (Addgene #81726), together with pDOR223-BRAF(G569R) were subcloned into pLX304 vector (Addgene plasmid #25890) with Gateway LR Clonase Kit (Thermo Fisher, #11791019). H358 STK11 KO and H358 KEAP1-KO cell lines were established and validated in a previous study19.
Preclinical models with acquired resistance to G12Ci treatment
Resistant models from cell culture:
H358 cells were cultured in the presence of increasing concentrations of G12Ci and passaged when reaching ~80% confluence. The main selection process spanned ~9 months. An initial treatment with early tool compounds was not potent enough to select for resistant subpopulations. Instead, longitudinal treatment with increasing concentrations (100–1000 nM) of MRTX1257 (a more potent analogue of adagrasib), led to a strong initial antiproliferative effect followed by expansion of resistant subpopulations. A brief exposure of resistant lines to sotorasib (up to 10 µM) was used to confirm resistance to both drugs. Following selection, resistant cell lines were maintained in sotorasib (1 µM) or adagrasib (100 nM) depending on availability. Serial sampling of drug-selected populations was carried out at various passages to determine the sensitivity to various G12Ci, as well as emerging genetic alterations, by using the assays described below. In some instances, the passages were further expanded (under the original selection condition) in order to have sufficient cells for downstream experiments. The passage number indicated in the figures does not reflect the same time interval between passages or lineages.
Resistant models from xenografts and cell culture:
These were established as described above with the exception that the first round of selection was carried out in mice bearing H358 xenografts treated until the tumors grew in the presence of the drug. Drug-resistant tumors were minced into single cell suspension, sorted to remove mouse cells and then passaged in cell culture as described above.
Single-cell DNA sequencing
This was carried out as described previously20,21. Briefly, the cells were washed with PBS and resuspended in Cell Buffer from the Tapestri Single-Cell DNA Core Ambient Kit v2 (Mission Bio PN MB51–0007), then stained with Trypan blue and assessed with the Countess II Automated Cell Counter (ThermoFisher) for both count and viability. Samples were diluted and ~140K cells were loaded onto the Tapestri Instrument (Mission Bio) for encapsulation, lysis, and protein digestion. Encapsulated cell lysate was then barcoded and target regions were amplified using the Tumor Hot Spot Panel (Mission Bio PN 165919) for 20 cycles PCR with 6 minutes extension/annealing at 61°C (10 cycles) and 48°C (10 cycles). Emulsions were broken and DNA was recovered and cleaned with AMPure XP beads (Beckman Coulter catalog # A63882) at a 1X ratio. Sequencing libraries were prepared according to Mission Bio protocols with 9 cycles PCR. Indexed libraries were pooled equimolar and sequenced on a NovaSeq 6000 in a PE150 run using the NovaSeq 6000 Reagent Kit (300 cycles) (Illumina) with 15% PhiX.
Sequence data were processed using the software provided by Mission Bio, according to the manufacturers instructions22. In brief, sequence reads were trimmed for adapter sequences using Cutadapt23 and mapped to the hg19 human genome using the Burrows-Wheeler Aligner (BWA)24,25 after extracting barcode information. Following mapping, on target sequences were selected using standard bioinformatics tool (SAMtools)26, and barcode sequences were error-corrected based on a white list of known sequences22. The number of cells was determined based on curve fitting a plot of number of reads assigned to each barcode versus barcodes ranked in decreasing order. GATK 3.727 was used to genotype the sample with a joint-calling approach. The quality score of each known variant was used to set a minimum threshold for variant calling in sample cells.
The loom files generated by the Tapestri pipeline were filtered and analyzed using the ‘tapestri’ R package (v1.1.0). Genotypes were extracted using several default filters, including a genotype quality cutoff of 30, a read depth cutoff of 10 and an allele frequency cutoff of 10. Also variants genotyped in less than 50% of cells and variants mutated in less than 1% of cell were removed. We mainly focused on cancer hotspot variants that were identified both using single cell and bulk sequencing. Other variants that were identified along with their allele frequencies are shown in Supplementary Data 2. The presence or absence of select (RAS or BRAF) mutations in single cells was determined either by using the genotype algorithm in tapestri or by relying on variant allele frequencies with an arbitrary cutoff of 0.05. For the latter, variants with an allele frequency between 0 and 0.05 were labeled as sub-threshold. Each approach produces similar mutant subpopulation distributions.
Dimensionality reduction and phylogenetic relationship.
This was achieved by using t-distributed stochastic neighbor embedding (t-SNE) on protein coding (non intronic) SNV and variant allele frequency (VAF), by using the ‘rtsne’ package in R. Cells with sub-threshold variants were not shown in visualizations. The relationships of single cells originating from the parental and resistant models were represented by using a neighbor-joining tree. The latter was established using the nj function in the ‘ape’ R package and a distance matrix based on the allele frequencies of a manually curated list of variants (including those acquired or lost in the parental to resistant transition). Cells with sub threshold variants were excluded from this analysis. To facilitate computation and visualization, a random sample of 1000 cells was used to construct the tree. The progression model of select acquired alterations was established using the Edmund’s algorithm in the ‘tronco’ R package.
Targeted bulk exome sequencing
Genomic DNA (gDNA) extracted from PDX or cell line models was subjected to targeted-capture massively parallel sequencing using the Memorial Sloan Kettering–Integrated Mutation Profiling of Actionable Cancer Targets (MSK-IMPACT) sequencing assay, as previously described28,29. In brief, all protein-coding exons and selected introns of 550 commonly implicated oncogenes, tumor suppressor genes and genes encoding members of pathways deemed actionable by targeted therapies were captured by hybridizing barcoded libraries to designed custom oligonucleotides (Nimblegen SeqCap). Genomic DNA (100–250 ng) was used to prepare barcoded sequence libraries (Kapa Biosystems), which were combined into equimolar pools of 13–21 samples. These pools were subsequently subjected to Illumina Hiseq 2000 for paired-end 100-bp sequencing, which produced a median of 588-fold coverage per DNA sample. CASAVA was used to demultiplex sequenced data, and reads were aligned to the reference human genome (hg19) using BWA and post-processed using the Genome Analysis Toolkit (GATK) according to GATK best practices. Single-nucleotide variants and small insertion-deletions (indels) were called through MuTect and GATK, respectively. The sequencing and data analysis was carried out in our institutional core facility. DNA from a pool of unmatched normal samples was used as normal baseline for comparison with sequenced samples to eliminate common polymorphisms and systematic sequencing artifacts. Many alterations were identified in bulk sequencing of H358 lineage and PDX models. Fig. 2 and Extended Data Fig. 2 show only variants that we deemed to be important, such as hotspot mutations that were identified across different sequencing strategies or variants that have been previously reported in PDX models, such as BRAF (S147N) and NF1(K1385R). Other alterations are shown in Supplementary Data 3 and 4. For Lu36 and Lu69, sequencing was carried out on cultured cell lines established from the respective PDX models. Sequencing of Lu36 revealed a large number of mutations, as shown in Supplementary Data 3.
Whole exome sequencing
This was carried out in our institutional core facility as described previously. Briefly, 100 ng of gDNA from parental or resistant lines (R1, R2) were used to prepare libraries by the KAPA Hyper Prep Kit (Kapa Biosystems KK8504) with 8 cycles of PCR. After sample barcoding, 100 ng of library were captured by hybridization using the xGen Exome Research Panel v1.0 (IDT) according to the manufacturer’s protocol. PCR amplification of the post-capture libraries was carried out for 8 cycles. Samples were run on a HiSeq 4000 in a PE100 run, using the HiSeq 3000/4000 SBS Kit (Illumina). Samples were covered to an average of 180X. Reads generated from sequencing were aligned to the human genome (hg19) using the Burrows-Wheeler Aligner (BWA, v0.6.2) and further processed by GATK. Picard (v1.92) was used for deduplication. MuTect (v1.1.4) was applied for calling SNVs; small somatic indels were called with VarScan2 (v2.3.6) and GATK HaplotypeCaller (v3.1.1). Since a matched normal sample was not available for this cell line, data analysis was carried out using the parental drug-sensitive cell line as a reference (Supplementary Data 4).
Amplicon sequencing
To confirm the presence of mutations identified from the sequencing assays above, gDNA extracted from cell lines or frozen tumor tissues (100 ng) was used as a template in PCR reactions using PrimeStar polymerase (Clontech) according to manufacture’s instructions (extension time of 30s, 30 cycles). The primers used are shown in Supplementary Table 1. PCR products were purified with DNA clean concentrator kit (Zymo Research) and submitted to Genewiz for Amplicon-EZ sequencing.
Mixing studies testing minor subpopulations
KRAS(G12C) mutant H358 cells (parental) and their dox-NRAS(Q61K) expressing derivatives were labeled with fluorescent reporters as indicated in the figure legends. The cells were sorted on BD Biosciences FACSAriaII, with a post-sort purity of 95%+, determined by running a small aliquot of the collected sample. Briefly, ~100,000 cells were washed with PBS and resuspended with PBS containing 1% BSA. The cells were filtered through 35-μm mesh-capped tubes (Falcon) and analyzed on BD Biosciences LSR Fortessa. To determine the effect on total cell viability mixtures of parental and dox-NRAS(Q61K) cells were plated into a low-attachment 96-well plate, followed by treatment with sotorasib at increasing concentrations for 72h. The viability following drug treatment was determined by the Celltiter Glo assay (Promega). To study the effect of subpopulations harboring NRAS(Q61K)/KRAS(G12C) (minor subclone) on the parental KRAS(G12C) population (major subclone), parental and dox-NRAS(Q61K) cells were mixed at various ratios and plated into ultra-low-attachment 6-well plates in complete culture medium containing dox (2 μg/mL) and sotorasib (1 μM). The distribution of subpopulation at baseline and after a 72 h treatment was determined by FACS on BD Biosciences LSR Fortessa. LIVE/DEAD™ Fixable Dead Cell Stain Kit (ThermoFisher) was used to stain dead cells. The effect of the 2ºNRAS subclone on the parental population was assayed as parental/(parental+2ºNRAS)*100. FACS data was gated and quantified using FCS Express 7 Research software (v7.04.0014). Data analysis was carried out with GraphPad Prism 9.0 software. To increase the specificity and minimize any potential confounding effects from the fluorescent reporter, we used two distinct pairings: BFP/dox-NRAS + unlabeled/parental (Fig. 3b and c) and GFP/dox-NRAS + RFP/parental (Extended Data Fig. 7e and f). Similar trends were observed in each approach.
Virus production and generation of stable cell lines
HEK293T cells were seeded at 90% density in a 10-cm dish and transfected with the expression vector and packaging vectors pMD2.G and psPAX2 using PolyJet (SignaGen, #SL100688) according to the manufacturer’s instructions. Conditioned medium containing recombinant viruses was collected and filtered through 0.45-μm filters (Millipore). The virus-containing medium was added to cells with 8 μg/ml Polybrene (Millipore) overnight. Approximately 24 h after infection, the cells were selected with 2 μg/ml of puromycin or 500 µg/ml of G418 (Thermo Fisher).
CRISPR-CAS9 functional genetic screen
The screen and data analysis were carried out as described previously8. Briefly, parental H358 cells (KRAS(G12C)-mutant, drug sensitive) and R1 cells (KRAS(G12C)/NRAS(Q61K)-mutant, drug-resistant) were infected with a SpCas9-expressing lentivirus at a multiplicity of infection (MOI) of 0.7, followed by blasticidin (10µg/mL) selection to establish SpCas9-expressing cells. The expression of CAS9 protein was confirmed by immunoblotting. R1-SpCas9 cells were also confirmed to have a similar IC50 to G12Ci treatment as their parental R1 cells. Subsequently the cells were transfected with lentivirus expressing the Brunello sgRNA library, which targets the entire genome (purchased from the Gene Editing and Screening Core at MSKCC). The infection was carried out at a MOI of 0.3 with a 500-fold coverage and in triplicates. After puromycin (2 μg/mL) selection for 5 days, surviving cells were harvested and a portion of the cells (equaling a 500-fold coverage of the library) was collected for genomic DNA (gDNA) extraction (T0). The remaining cells were plated into T150 flasks and were treated with either DMSO or sotorasib at a concentration of 1 µM. Cells were refreshed with drug or DMSO- containing media every three days and passed when confluent to maintain at least 500-fold coverage of cell number. Fourteen-days after drug treatment, the cells were harvested and gDNA was extracted with a Blood and Cell Culture DNA Maxi Kit (Qiagen) according to the manufacturer’s protocols. NSG library prepared from gDNA were subjected to Hiseq. Data analysis was carried out in edgeR (v3.30.3), as described previously8. Genes depleted with sotorasib treatment (log2 fold change less than 1 relative to DMSO and FDR less than 0.05) in R1 but not H358 cells were considered as selective vulnerabilities in resistant cells. Raw count and processed data from the screen are shown in Supplementary Data 5. Correction for multiple hypothesis testing was carried out in edgeR using the Benjamini-Hochberg FDR method. The results are reported in Supplementary Data 5.
KRAS activation assay
KRAS activity was detected using the active RAS pull-down and detection kit (Thermo Fisher Scientific). Briefly, GST–RAF1 RAS-binding domain (RBD) and glutathione agarose resin were mixed together with whole-cell lysates and incubated on a rotator for 1 h at 4 °C, followed by 3 washes and elution with 2x SDS–PAGE loading buffer. The samples were then analyzed by SDS-PAGE and Western blot analysis with a KRAS-specific antibody. When HA–KRAS/NRAS/MRAS mutants were exogenously expressed, an HA-specific antibody enabled specific determination of these mutants in their GTP-bound conformation.
Immunoblotting
Cells were harvested and lysed with NP40 lysis buffer (50mM Tris (pH7.5), 1% NP40, 150mM NaCl, 10% glycerol and 1 mM EDTA) containing protease (Pierce Protease Inhibitor Mini Tablets, Thermo Fisher Scientific #88665) and phosphatase (Pierce Phosphatase Inhibitor Mini Tablets, Thermo Fisher Scientific #88667) inhibitors on ice for 10 min. After that, lysates were centrifuged at 16,000g for 10min before protein concentration was quantified by the BCA assay (Thermo Fisher Scientific). The proteins were resolved on 4–12% SDS-PAGE gels (Thermo Fisher Scientific) in 1X MOPS buffer (Thermo Fisher Scientific) at 90–120 constant voltage (V) and transferred to nitrocellulose membranes (GE Healthcare) with 1x Tris-Glycine Buffer (BioRad) at 100 V for 1 hour. Membranes were blocked in 5% nonfat milk for 1 hour and then probed with primary antibodies overnight at 4 °C and visualized using horseradish peroxidase (HRP)-conjugated secondary antibodies and ECL (Thermo Fisher Scientific).
Antibodies were obtained from commercial vendors as noted below. The antibodies were by the manufacturer and in previous publications8. Antibodies used in immunoblotting include: NRAS clone C-20 (Santa Cruz Biotechnology, lot: sc-519, 1:100); phospho-ERK (Cell Signaling Technology, lot: 9101, 1:1000), ERK (Cell Signaling Technology, lot:4696, 1:1000), phospho-RSK(Thr359) (Cell Signaling Technology, lot:8753, 1:1000), RSK (Cell Signaling Technology, lot:9355,1:1000), cleaved PARP (Cell Signaling Technology, lot:5625,1:1000), SHOC2 (Cell Signaling Technology, lot:53600, 1:1000), β-actin (Cell Signaling Technology, lot:4970,1:1000) and HA (Cell Signaling Technology, lot:3724,1:1000); KRAS clone 3B10–2F2 (Sigma-Aldrich, lot:WH0003845M1,1:1000) and pCRAF (S338) (Millipore Sigma, lot: 05–538, 1:1000); CRAF (BD bioscience, lot: 610152, 1:1000). Immunoblots were quantified using ImageJ (v2.0.0-rc-65/1.51w).
Clonogenic assay using crystal violet staining
Related cells were plated into 6-well plate or 12-well plate at 1 × 10⁵ cells or 5 × 10⁴ cells per well respectively and treated as indicated for 6–10 days. Then media was aspirated, and cells were fixed with cold methanol for 10 min. Fixed cells were stained with crystal violet (0.05%) for 30 min at room temperature. The dye was washed off with water and the places were scanned after drying.
Cell viability assay and cell proliferation assay
The cells were seeded in 96-well plates at 2,000 cells per well in triplicates (at minimum) and treated with the indicated concentrations of drugs. For dox inducible cell lines, cells were treated with indicated concentrations of dox together with drugs. After 72 h, cell viability was assayed by CellTiterGlo Luminescent Cell Viability Assay (Promega). For longer culture time the number of cells seeded initially was lower (100 cells/well). The background value (media without cells) was subtracted from the raw data and fold change was calculated relative to time zero.
Gene silencing with siRNAs
Cells were reverse-transfected with siRNA at 25nM each for 3 days and/or 5 days with Lipofectamine RNAi Max kit (Thermo Fisher, #13778075) according to manufacture’s instruction. SMARTPool of ON-TARGETplus Human NRAS siRNAs were obtained from Horizon. siNRAS transfected R1 cells were treated with sotorasib at 1 µM or DMSO for 3 days and 5 days before being collected for protein extraction as well as western blot detection for ERK activities. Or transfected R1 cells were plated into 96-well plate and treated with indicated concentrations of sotorasib for 3 days and 5 days before cell viability was determined by Celltiter Glo assay (Promega).
Mouse studies
These were carried out as described8,30. Briefly, 6–8 weeks old female nu/nu athymic mice (Envigo) or NSG mice (Jackson Laboratory) were maintained according to Institutional Animal Care and Use Committee (IACUC) guidelines in MSKCC (protocol: 18–05-007). The mice studies were performed in compliance with protocols approved by IACUC. The maximal tumor measurement permitted is 1.5 cm, and this was not exceeded in any of our experiments. A sample size of 5 mice per cohort enables 80% power to detect an odds parameter of 14.0 for each pairwise comparison, with two-sided α level = 0.05. Animals were maintained in accordance with the Guide for the Care and Use of Laboratory Animals in an AAALAC-accredited facility. Animals were housed in individually ventilated caging systems (Thoren Caging Systems, Hazleton, PA), whose effluent was exhausted directly into the building’s HVAC system, on autoclaved aspen chip bedding (PJ Murphy Forest Products, Montville, NJ) and were provided a γ-irradiated commercial diet (PicoLab Rodent Diet 20, 5053 LabDiet, PMI Nutrition International, St Louis, MO), and acidified water (pH 2.5 to 2.8) ad libitum. Mice were housed at a population density that ranged from 1 to 5 mice per cage in an environment providing a temperature of 21.1 to 22.2 °C (70 to 72 °F), 30% to 70% humidity, 10 to 15 fresh air exchanges hourly, and a 12:12-h light:dark cycle (lights on, 0600 to 1800). Resistant cells were injected subcutaneously in the flanks of mice and monitored for tumor growth. Mice with xenografts were selected for efficacy studies in an unbiased manner. Once tumors reached 100-mm3 volume, mice were randomized and treated with drug or the appropriate vehicle control. Mice were administered by oral gavage and the average tumor diameter (two perpendicular axes of the tumor were measured) was measured in control and treated groups using a caliper in a non-blinded manner by a research technician who was not aware of the objectives of the study. Data analysis was done by Prism (GraphPad Software, v9.1.0). For each study arm, the percentage difference in tumor growth relative to T0 was plotted over time. Statistically significant differences for select treatment time points were determined using the two-tailed t-test function embedded in Prism.
Extended Data
Extended Data Figure 1. Characteristics of lung cancer patients with an exceptional response to sotorasib treatment.

a, Percent of patients with baseline alterations in the indicated genes. No significant differences by Fisher exact test. b, KRAS(G12C) allele frequency in baseline plasma specimens. c, As in b but only patients with available archival/baseline tissue are plotted. d, Baseline tumor burden, as determined by the sum of the longest diameter in RECIST target lesions. Two tailed p values from Mann-Whitney tests are shown in b-d. The lines denote median values. In a, b and d: n=8 (CR/LTR) and n=28 (Other) patients, whereas in c: n=5 (CR/LTR) and n=8 (Other) patients.
Extended Data Figure 2. Treatment-emergent alterations in patient-derived xenograft models.
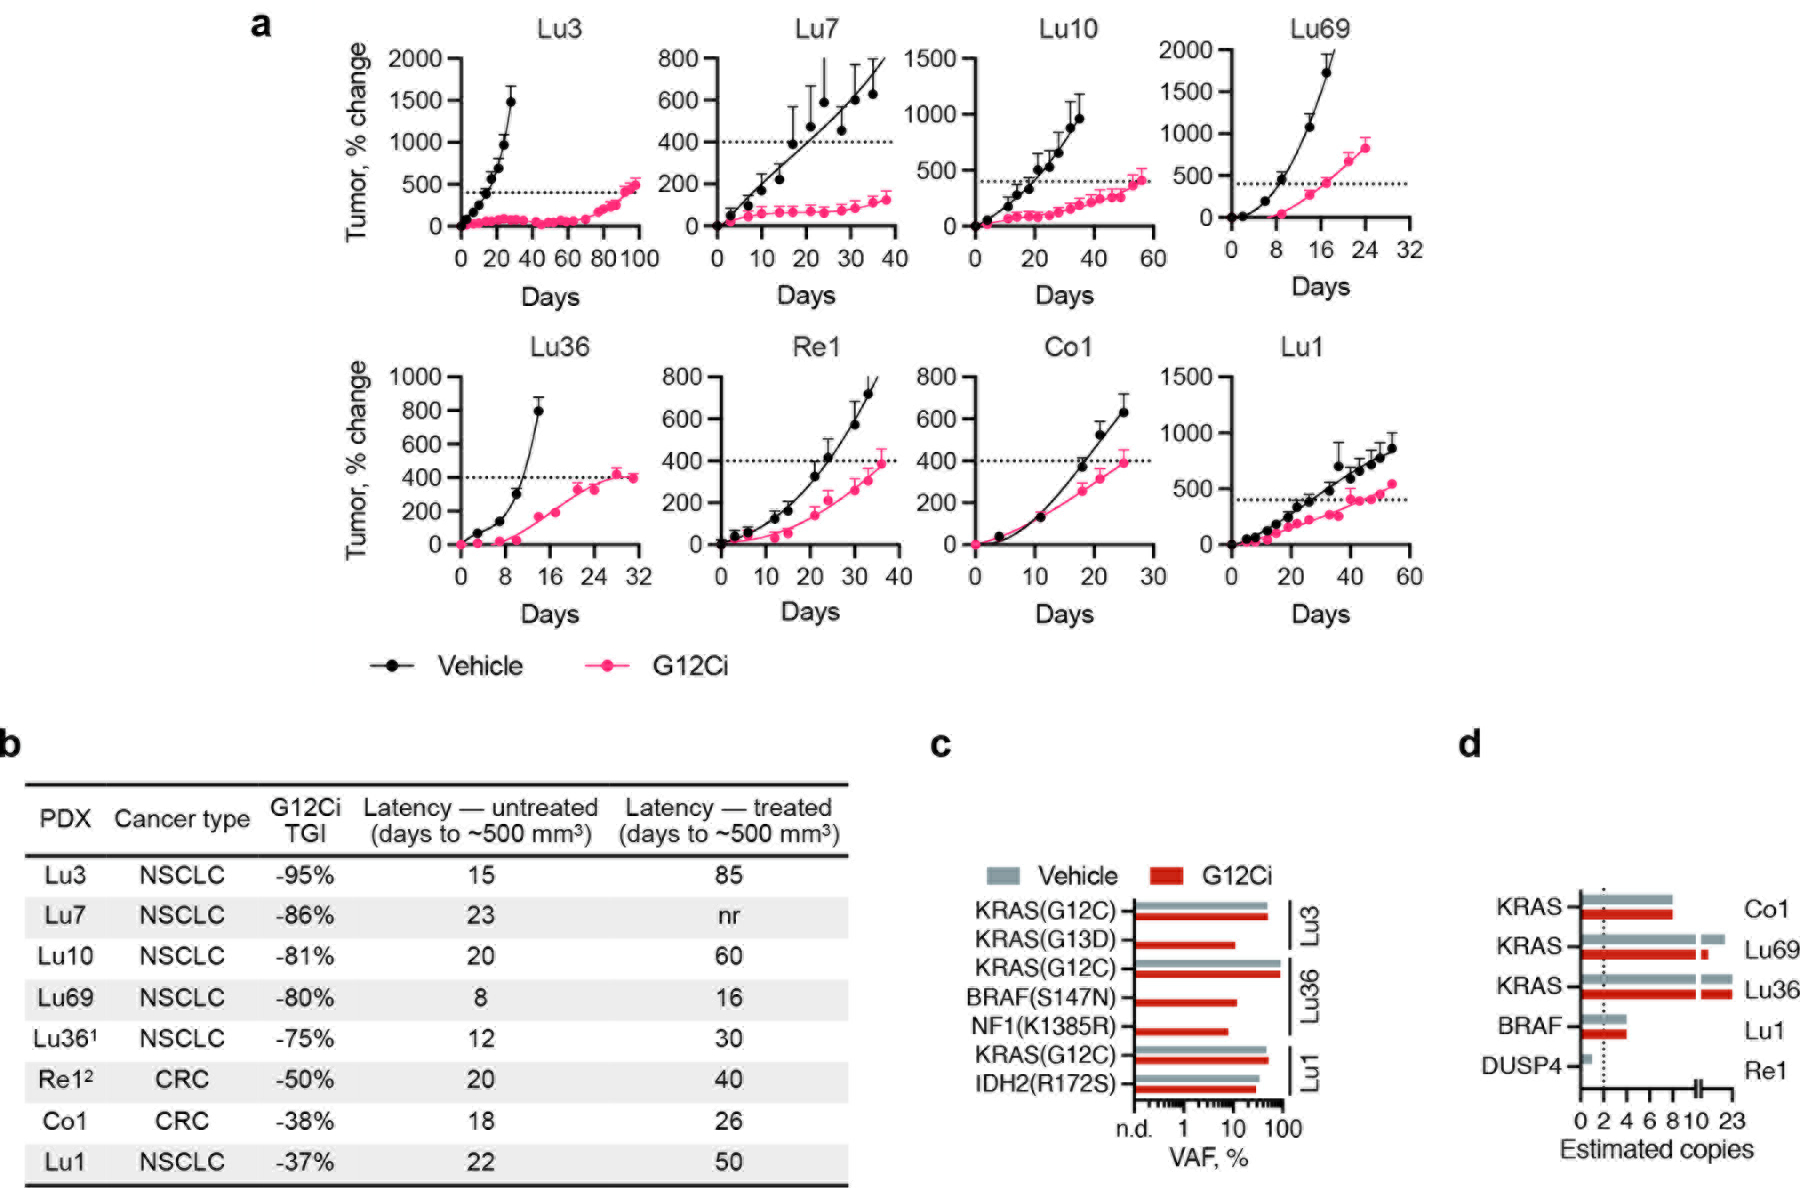
a, PDX-bearing mice were treated with sotorasib (100 mpk, Lu1, Lu10), adagrasib (100 mpk, Lu3, Lu7, Re1, Co1) or MRTX1257 (50 mpk, Lu36, Lu69). The doted line represents a tumor size of ~500 mm3, which was used to determine latency (n=4, mean ± s.e.m). b, Characteristics of patient derived xenograft models. c-d, VAFs or estimated copy numbers for the indicated variants (c) or genes (d). A large number of mutations were identified in Lu36, including several BRAF alterations. Re1 had a baseline BRAF(E26D) variant, which has been reported as germline. See Supplemental Data 3 for complete list of alterations.
Extended Data Figure 3. Characterization of cell lines with acquired G12Ci resistance.

a, G12Ci-sensitive lung cancer cells (H358) were selected in the absence (H358T) or in the presence of G12Ci-treatment (see methods), either in cell-culture (1M) or in athymic mice followed by cell-culture (R1, R2). b, The indicated cell lines were treated with sotorasib (left) or adagrasib (right) for 72h to determine the effect on cell proliferation (n=3, mean ± s.e.m). c, d, Resistant (1M, R1, R2) or parental (P) cells were treated with the indicated inhibitors for two weeks to determine the effect of cell viability by crystal violet staining. A representative of two independent experiments is shown. e, Athymic mice bearing parental (H358T, Par) or resistant (R1, R2) cell line xenografts were treated with vehicle or MRTX1257 (50 mpk) to determine the effect on tumor growth (n=5, mean ± s.e.m). f-g, The indicated cell lines were treated with increasing concentrations of sotorasib for 2 hours (f) or with 1μM over time (g). The effect on KRAS signaling was determined by immunoblotting. A representative of at least two independent experiments for each cell line is shown. For gel source data, see Supplementary Figure 1.
Extended Data Figure 4. Single-cell modeling of G12Ci-resistant models.

a, Boxplots (median, upper and lower quartiles, and outliers) showing the distribution of the allele frequency (VAF) for the indicated variants across subclonal populations in G12Ci-resistant models. b, A neighbor-joining tree showing the relationship of the single-cells originating from the indicated parental or resistant models. The circular heat map indicates the presence (blue) or absence (white) of the indicated variants in each single cell.
Extended Data Figure 5. Secondary RAS mutations in the absence of KRAS-directed therapy.

a, Heat map of 304 KRAS-mutant biopsy specimens harboring multiple RAS variants. b, Alluvial plot showing the pairings of mutations across samples. Residues with cancer-associated hotspot mutations are labeled. c, As in a but only KRAS(G12C) mutant samples are shown. d, Frequency of 2oRAS mutations in samples with KRAS(G12C) (left) or any KRAS mutation (right). All specimens were sequenced using MSK-IMPACT.
Extended Data Figure 6. Propensity of treatment-emerging alterations to attenuate KRAS(G12C) inhibition.

a-g, H358 cells expressing the indicated variants under dox-inducible promoters (a-f) or H358 cells with CRISPR/CAS9 mediated deletion of KEAP1 or STK11 (g, ref. 19), were treated as shown to determine the effect on signaling intermediates by immunoblotting (a) or cell viability (b-g) using cell titer glow. In b-f, n=3, in g, n=4. Mean ± s.e.m. are shown. A representative of at least two independent experiments is shown. For gel source data of a, see Supplementary Figure 1.
Extended Data Figure 7. Progressive attenuation of KRAS(G12C) singling inhibition during drug selection.

a-b, KRAS(G12C) mutant cells were expanded in the presence of G12Ci-treatment to establish isogenic lineages (1M, R1 and R2) with acquired resistance. Serial passages (p) from the indicated lineages were assayed to determine the magnitude and duration of ERK inhibition (a) or cleaved PARP induction (b) after drug re-challenge for 0–72h. In the 1M series, p15 and p25 denote passages when the selection drug concentration was increased. The experiment was carried out several passages later. p0 denotes parental cells. pERK and cPARP immunoblots were quantified with imageJ and their expression level was normalized to time 0. c, Unlabeled parental (H358) cells and BFP-labeled derivatives expressing dox-inducible NRAS(Q61K) were co-cultured in the presence of dox and/or sotorasib for 72h (n=4, mean ± s.e.m). d, Parental H358 cells or their derivatives expressing NRAS(Q61K) (100%) were treated in the presence of sotorasib in the presence or absence of dox for 72h (n=4, mean ± s.e.m.). Norm: min-max normalization. e-f, RFP-labeled parental (H358) cells and GFP-labeled derivatives expressing dox-inducible NRAS(Q61K) were co-cultured in the presence of dox and/or sotorasib for 72h to determine the distribution of subpopulations (e) by FACS (n=20,000 independent single cells) and the effect of the minor 2oNRAS subclone on the major KRAS(G12C)-mutant parental subpopulation (f). A representative of two independent experiments is shown in e-f.
Extended Data Figure 8. Selective vulnerabilities in resistant cells harboring KRAS and NRAS mutations.

a, Parental H358 (sensitive) and R1 (resistant) cells expressing CAS9 were transfected with a genome-wide sgRNA library. The cells were treated in triplicate with either DMSO or G12Ci (sotorasib, 1 µM) for 14 days. The scaled mean expression of four independent sgRNAs targeting the indicate genes is shown. b-c, Parental or resistant cells expressing control (sgNT) or SHOC2-specific sgRNAs were subjected to immunoblotting to determine the expression of SHOC2 (b) or the effect on the indicated signaling intermediates (c). d-f, Parental (d), R1 (e) and R2 (f) cells were treated with either DMSO or sotorasib for 10 days to determine the effect on cell number (n=4, mean ± s.e.m). g-h, R1 cells expressing NRAS-specific siRNAs were treated with sotorasib for the indicated times to determine the effect on signaling intermediates (g) or proliferation (h, n=6, mean ± s.e.m). A representative of at least two independent experiments is shown. For gel source data, see Supplementary Figure 1.
Extended Data Figure 9. Co-targeting ERK-signaling enhances KRAS(G12C) inhibition in models harboring secondary RAS/BRAF mutations.

a-b, The indicated models were treated with sotorasib (1 µM) in combination with trametinib (25 nM, a) or LXH254 (2 µM; b) to determine the effect on ERK signaling intermediates. For gel source data, see Supplementary Figure 1. c. Resistant and parental cell lines were treated with G12Ci (sotorasib, 1 µM; adagrasib, 200 nM or MRTX1257, 200 nM) in combination with a RAFdi (LXH254, 2µM), MEKi (trametinib, 50 nM) or ERKi (SCH984, 500 nM) to determine the effect on cell viability. d-f, H358 cells expressing the dox-induced variants shown were treated with sotorasib (1 µM) alone or in combination with the noted inhibitors to determine the effect on cell viability over time, using cell titer glow (d, n=4 and e, n=6; mean is shown) or crystal violet staining (f, 10 days). A representative of two independent repeats is shown.
Extended Data Figure 10. Targeting KRAS(G12C) in combination with MAPK intermediates in vivo.

Mice bearing the indicated cell line (a, n=5, mean ± s.e.m.) or patient-derived xenograft (b, n=4, mean ± s.e.m.) were treated with the inhibitors shown to determine the effect on tumor growth. Fractional differences in tumor volume over time are shown.
Supplementary Material
Acknowledgements:
The authors thank Megan Mroczkowski her insight on the manuscript. P.L. is supported in part by the NIH/NCI (1R01CA23074501 to P.L., 1R01CA23026701A1 to P.L.; K08CA191082–01A1 to P.L.), The Pew Charitable Trusts, the Damon Runyon Cancer Research Foundation and the American Lung Association. Y.Z. is supported in part by Charles H. Revson Senior Fellowship in Biomedical Science (21–31). J.X. is supported in part by the NRSA F30 program (1F30CA232549–01). E.d.S. is supported in part by the MSKCC Pilot Center for Precision Disease Modeling program (U54 OD020355). K.C.A. is supported in part by a Career Development Award from the LUNGevity foundation. J.S.R.-F. is supported in part by the Breast Cancer Research Foundation and Gerald Leigh Charitable Trust. B.W. in part by Cycle for Survival and Breast Cancer Research Foundation grants. J.S.R-F and B.W. are supported in part by the NIH/NCI P50 CA247749 01 grant. Y.R.M.G. is supported by a Young Investigator Award from Conquer Cancer from the ASCO Foundation and has received training through an institutional K30 grant (CTSA UL1TR00457). The authors acknowledge the Josie Robertson Investigator Program at MSKCC, a Medical Scientist Training Program grant to the Weill Cornell-Rockefeller-Sloan Kettering Tri- Institutional MD-PhD Program (T32GM007739) and the MSKCC Support Grant-Core Grant program (P30 CA008748). We acknowledge the use of the Integrated Genomics Operation Core, funded by the NCI Cancer Center Support Grant (CCSG, P30 CA08748), Cycle for Survival, and the Marie-Josée and Henry R. Kravis Center for Molecular Oncology. Clinical study funding was provided by Amgen Inc.
Footnotes
Competing Interests:
P.L. reports grants to his institution from Amgen, Mirati, Revolution Medicines, Boehringer Ingelheim and Virtec Pharmaceuticals. P.L. listed as an inventor on patents filed by MSKCC on the treatment of BRAF or KRAS mutant cancers. P.L. reports consulting fees from Black Diamond Therapeutics and compensated scientific advisory board activity in Revolution Medicines. J.S.R.-F. reports receiving personal/consultancy fees from Goldman Sachs, REPARE Therapeutics, Paige.AI and Eli Lilly, membership of the scientific advisory boards of VolitionRx, REPARE Therapeutics and Paige.AI, membership of the Board of Directors of Grupo Oncoclinicas, and ad hoc membership of the scientific advisory boards of Roche Tissue Diagnostics, Ventana Medical Systems, Novartis, Genentech and InVicro, outside the scope of this study. J.S.R.-F. owns Paige.AI and REPARE Therapeutic stocks. Y.R.M.G. received support for travel, accommodation and expenses from AstraZeneca. M.B. reports consulting fees from Roche and Eli Lilly. A.A., A.S., D.M., P.A. and J.R.L. are employees and shareholders of Amgen Inc. The other authors do not report any conflicts of interests.
Author Information:
Reprints and permissions information is available at www.nature.com/reprints.
Code availability
The analysis was performed using standard protocols with previously described computational tools. No custom code was used in this study.
Data availability
The data supporting the findings of this study are available within the paper and its supplementary information files. The data have been deposited in Sequence Read Archive (PRJNA756044). Genomic and associated clinical data for patients are available in cBioPortal for Cancer Genomics at http://cbioportal.org/msk-impact and/or may be requested by qualified researchers from Amgen clinical studies. Complete details are available at: http://www.amgen.com/datasharing. Materials, reagents or other experimental data are available upon reasonable request.
References
- 1.Ostrem JM, Peters U, Sos ML, Wells JA & Shokat KM K-Ras(G12C) inhibitors allosterically control GTP affinity and effector interactions. Nature 503, 548–551, doi: 10.1038/nature12796 (2013). [DOI] [PMC free article] [PubMed] [Google Scholar]
- 2.Lito P, Solomon M, Li LS, Hansen R & Rosen N Allele-specific inhibitors inactivate mutant KRAS G12C by a trapping mechanism. Science 351, 604–608, doi: 10.1126/science.aad6204 (2016). [DOI] [PMC free article] [PubMed] [Google Scholar]
- 3.Patricelli MP et al. Selective Inhibition of Oncogenic KRAS Output with Small Molecules Targeting the Inactive State. Cancer Discov 6, 316–329, doi: 10.1158/2159-8290.CD-15-1105 (2016). [DOI] [PubMed] [Google Scholar]
- 4.Janes MR et al. Targeting KRAS Mutant Cancers with a Covalent G12C-Specific Inhibitor. Cell 172, 578–589 e517, doi: 10.1016/j.cell.2018.01.006 (2018). [DOI] [PubMed] [Google Scholar]
- 5.Canon J et al. The clinical KRAS(G12C) inhibitor AMG 510 drives anti-tumour immunity. Nature 575, 217–223, doi: 10.1038/s41586-019-1694-1 (2019). [DOI] [PubMed] [Google Scholar]
- 6.Hallin J et al. The KRAS(G12C) Inhibitor MRTX849 Provides Insight toward Therapeutic Susceptibility of KRAS-Mutant Cancers in Mouse Models and Patients. Cancer Discov 10, 54–71, doi: 10.1158/2159-8290.CD-19-1167 (2020). [DOI] [PMC free article] [PubMed] [Google Scholar]
- 7.Kim D, Xue JY & Lito P Targeting KRAS(G12C): From Inhibitory Mechanism to Modulation of Antitumor Effects in Patients. Cell 183, 850–859, doi: 10.1016/j.cell.2020.09.044 (2020). [DOI] [PMC free article] [PubMed] [Google Scholar]
- 8.Xue JY et al. Rapid non-uniform adaptation to conformation-specific KRAS(G12C) inhibition. Nature 577, 421–425, doi: 10.1038/s41586-019-1884-x (2020). [DOI] [PMC free article] [PubMed] [Google Scholar]
- 9.Hong DS et al. KRAS(G12C) Inhibition with Sotorasib in Advanced Solid Tumors. N Engl J Med 383, 1207–1217, doi: 10.1056/NEJMoa1917239 (2020). [DOI] [PMC free article] [PubMed] [Google Scholar]
- 10.Pylayeva-Gupta Y, Grabocka E & Bar-Sagi D RAS oncogenes: weaving a tumorigenic web. Nature reviews. Cancer 11, 761–774, doi: 10.1038/nrc3106 (2011). [DOI] [PMC free article] [PubMed] [Google Scholar]
- 11.Simanshu DK, Nissley DV & McCormick F RAS Proteins and Their Regulators in Human Disease. Cell 170, 17–33, doi: 10.1016/j.cell.2017.06.009 (2017). [DOI] [PMC free article] [PubMed] [Google Scholar]
- 12.Karoulia Z, Gavathiotis E & Poulikakos PI New perspectives for targeting RAF kinase in human cancer. Nature reviews. Cancer 17, 676–691, doi: 10.1038/nrc.2017.79 (2017). [DOI] [PMC free article] [PubMed] [Google Scholar]
- 13.Riely GJ et al. Frequency and distinctive spectrum of KRAS mutations in never smokers with lung adenocarcinoma. Clin Cancer Res 14, 5731–5734, doi: 10.1158/1078-0432.CCR-08-0646 (2008). [DOI] [PMC free article] [PubMed] [Google Scholar]
- 14.Cancer Genome Atlas Research, N. Comprehensive molecular profiling of lung adenocarcinoma. Nature 511, 543–550, doi: 10.1038/nature13385 (2014). [DOI] [PMC free article] [PubMed] [Google Scholar]
- 15.Jänne PA, R. I., Spira AI, Riely GJ, Papadopoulos KP, Sabari JK, Johnson ML, Heist RS, Bazhenova L, Barve M, Pacheco JM, Leal TA, Velastegui K, Conrelius C, Plson P, Christensen JG, Kheoh T, Chao RC, Ou SHI. in 2020. EORTC-NCI-AACR Symposium
- 16.Misale S et al. KRAS G12C NSCLC Models Are Sensitive to Direct Targeting of KRAS in Combination with PI3K Inhibition. Clin Cancer Res 25, 796–807, doi: 10.1158/1078-0432.CCR-18-0368 (2019). [DOI] [PubMed] [Google Scholar]
- 17.Boned Del Rio I et al. SHOC2 complex-driven RAF dimerization selectively contributes to ERK pathway dynamics. Proc Natl Acad Sci U S A 116, 13330–13339, doi: 10.1073/pnas.1902658116 (2019). [DOI] [PMC free article] [PubMed] [Google Scholar]
- 18.Jones GG et al. SHOC2 phosphatase-dependent RAF dimerization mediates resistance to MEK inhibition in RAS-mutant cancers. Nat Commun 10, 2532, doi: 10.1038/s41467-019-10367-x (2019). [DOI] [PMC free article] [PubMed] [Google Scholar]
- 19.Wohlhieter CA et al. Concurrent Mutations in STK11 and KEAP1 Promote Ferroptosis Protection and SCD1 Dependence in Lung Cancer. Cell Rep 33, 108444, doi: 10.1016/j.celrep.2020.108444 (2020). [DOI] [PMC free article] [PubMed] [Google Scholar]
- 20.Gao Y et al. V211D Mutation in MEK1 Causes Resistance to MEK Inhibitors in Colon Cancer. Cancer Discov 9, 1182–1191, doi: 10.1158/2159-8290.CD-19-0356 (2019). [DOI] [PMC free article] [PubMed] [Google Scholar]
- 21.Miles LA et al. Single-cell mutation analysis of clonal evolution in myeloid malignancies. Nature 587, 477–482, doi: 10.1038/s41586-020-2864-x (2020). [DOI] [PMC free article] [PubMed] [Google Scholar]
- 22.Pellegrino M et al. High-throughput single-cell DNA sequencing of acute myeloid leukemia tumors with droplet microfluidics. Genome Res 28, 1345–1352, doi: 10.1101/gr.232272.117 (2018). [DOI] [PMC free article] [PubMed] [Google Scholar]
- 23.Bolger AM, Lohse M & Usadel B Trimmomatic: a flexible trimmer for Illumina sequence data. Bioinformatics 30, 2114–2120, doi: 10.1093/bioinformatics/btu170 (2014). [DOI] [PMC free article] [PubMed] [Google Scholar]
- 24.Langmead B, Trapnell C, Pop M & Salzberg SL Ultrafast and memory-efficient alignment of short DNA sequences to the human genome. Genome Biol 10, R25, doi: 10.1186/gb-2009-10-3-r25 (2009). [DOI] [PMC free article] [PubMed] [Google Scholar]
- 25.Kim D et al. TopHat2: accurate alignment of transcriptomes in the presence of insertions, deletions and gene fusions. Genome Biol 14, R36, doi: 10.1186/gb-2013-14-4-r36 (2013). [DOI] [PMC free article] [PubMed] [Google Scholar]
- 26.Li H et al. The Sequence Alignment/Map format and SAMtools. Bioinformatics 25, 2078–2079, doi: 10.1093/bioinformatics/btp352 (2009). [DOI] [PMC free article] [PubMed] [Google Scholar]
- 27.McKenna A et al. The Genome Analysis Toolkit: a MapReduce framework for analyzing next-generation DNA sequencing data. Genome Res 20, 1297–1303, doi: 10.1101/gr.107524.110 (2010). [DOI] [PMC free article] [PubMed] [Google Scholar]
- 28.Cheng DT et al. Memorial Sloan Kettering-Integrated Mutation Profiling of Actionable Cancer Targets (MSK-IMPACT): A Hybridization Capture-Based Next-Generation Sequencing Clinical Assay for Solid Tumor Molecular Oncology. J Mol Diagn 17, 251–264, doi: 10.1016/j.jmoldx.2014.12.006 (2015). [DOI] [PMC free article] [PubMed] [Google Scholar]
- 29.Zehir A et al. Mutational landscape of metastatic cancer revealed from prospective clinical sequencing of 10,000 patients. Nat Med 23, 703–713, doi: 10.1038/nm.4333 (2017). [DOI] [PMC free article] [PubMed] [Google Scholar]
- 30.Xue Y et al. An approach to suppress the evolution of resistance in BRAF(V600E)-mutant cancer. Nat Med 23, 929–937, doi: 10.1038/nm.4369 (2017). [DOI] [PMC free article] [PubMed] [Google Scholar]
Associated Data
This section collects any data citations, data availability statements, or supplementary materials included in this article.
Supplementary Materials
Data Availability Statement
The data supporting the findings of this study are available within the paper and its supplementary information files. The data have been deposited in Sequence Read Archive (PRJNA756044). Genomic and associated clinical data for patients are available in cBioPortal for Cancer Genomics at http://cbioportal.org/msk-impact and/or may be requested by qualified researchers from Amgen clinical studies. Complete details are available at: http://www.amgen.com/datasharing. Materials, reagents or other experimental data are available upon reasonable request.