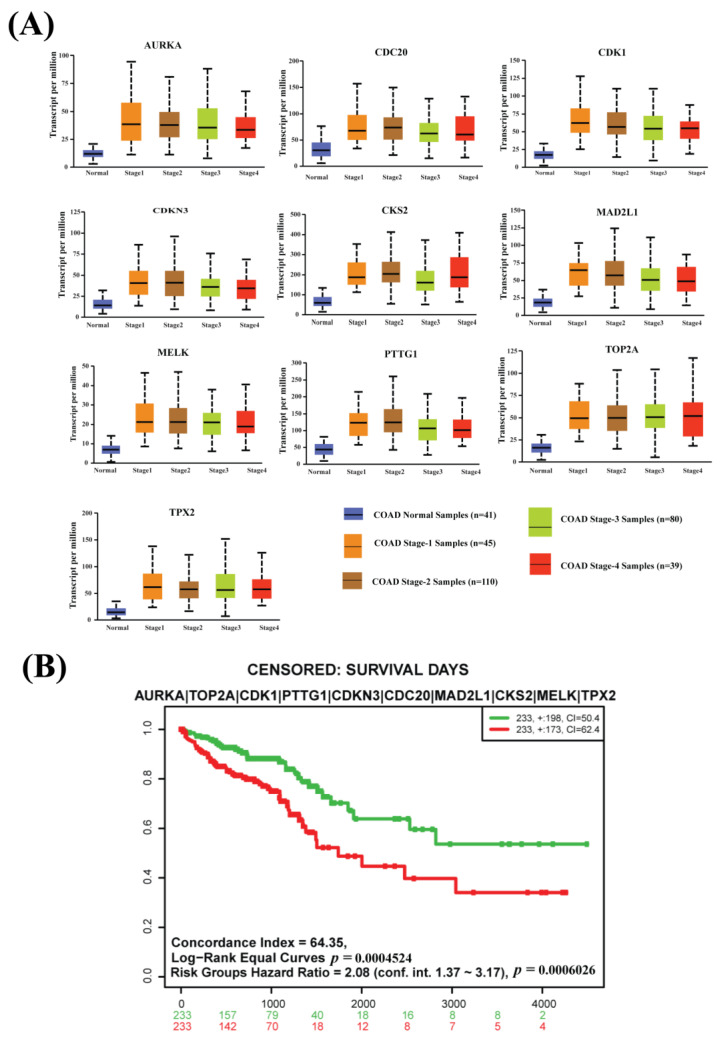
Figure 4.
(A) Box plots for the expressions of CGs with various stages of colon adenocarcinoma (Stage 1, Stage 2, Stage 3, and Stage 4) using the COAD database and comparison with the control stage from the TCGA database. (B) The multivariate Kaplan–Meier survival probability plot of CRC patients with the CGs-expressions using the TCGA-COAD and TCGA-READ databases.

