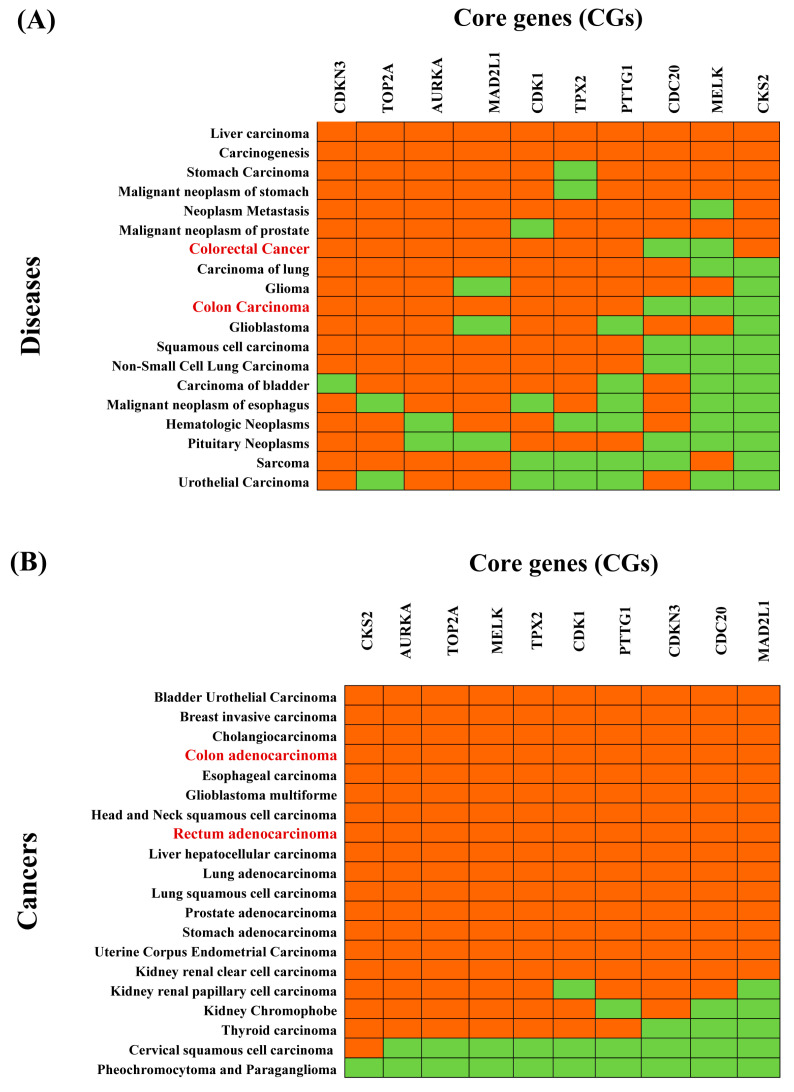
Figure 5.
Association of CRC-causing CGs with different diseases. (A) Top 20 diseases associated with CGS obtained by disease-CGs association studies based on the Enrichr web tool with the DisGeNET database, where red and green colors indicate presence and absence, respectively. The red colour text in the column represent CRC-related cancers. (B) Top 20 cancers associated with CGs obtained by pan-cancer analysis based on the TIMER2 web tool with the TCGA database, where red and green colors indicate significant (p-value < 0.05) and insignificant (p-value ≥ 0.05) pairwise gene-disease association, respectively. The red colors text in the column represents CRC-related cancers.

