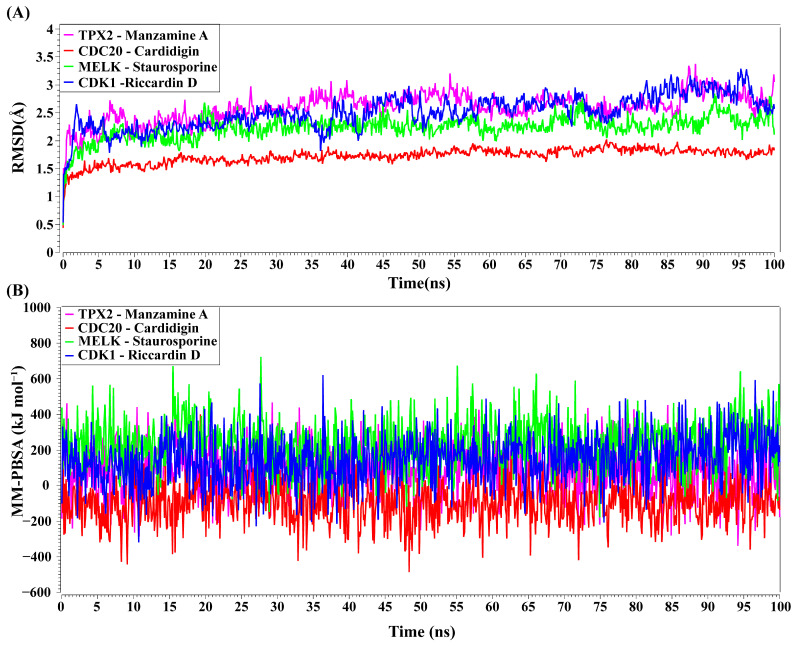
Figure 8.
MD simulations of top-ranked complexes. (A) Time evolution of RMSDs for each of top-ranked complexes. (B) Binding stability of top-ranked four complexes by MM-PBSA binding free energy (kJ mol−1) against each ns of simulation; greater positive values show strong binding. Complexes: red color CDC20–Cardidigin, green color MELK–Staurosporine, pink color TPX2–Manzamine A, and blue color CDK1–Riccardin-D.

