
Table 3.
The 1st, 2nd, 3rd column show potential targets, 2-dimentional(2d) structure of lead compounds, top ordered binding affinities (kcal mol−1), respectively. The 3-dimension(3d) view of top ranking drug-target complexes is shown in the 4th column. Finally, the last column shows key elements of interacting amino acids, including hydrogen bond, hydrophobic interactions, and electrostatic.
| Potential Targets | Structure of Top Compounds | Binding Affinity Score (kcal mol−1) | 3D Structures of Complex with Interactions | Interacting Amino Acids | ||
|---|---|---|---|---|---|---|
| Hydrogen Bond |
Hydrophobic Interactions |
Electrostatic | ||||
| TPX2 | Manzamine A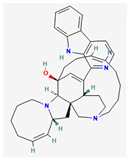
|
−12.4 |
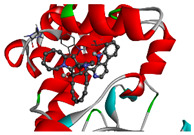
|
- | VAL317 TRP313 HIS366 |
- |
| CDC20 | Cardidigin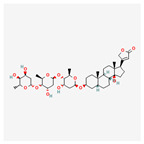
|
−11.0 |
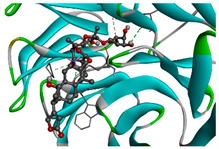
|
TRP317 PRO319 VAL190 LEU449 PRO319 |
LYS236 | - |
| MELK | Staurosporine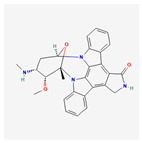
|
−13.4 |
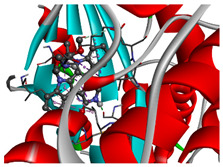
|
GLU87 GLU136 CYS89 ASP150 |
ILE17 VAL25 LEU139 LEU149 ALA38 ILE149 LYS40 |
- |
| CDK1 | Riccardin D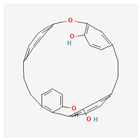
|
−11.3 |
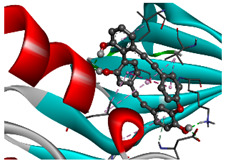
|
LEU83, ASP146, LYS33 |
VAL18 LEU135 ILE10 ALA31 VAL64 |
- |