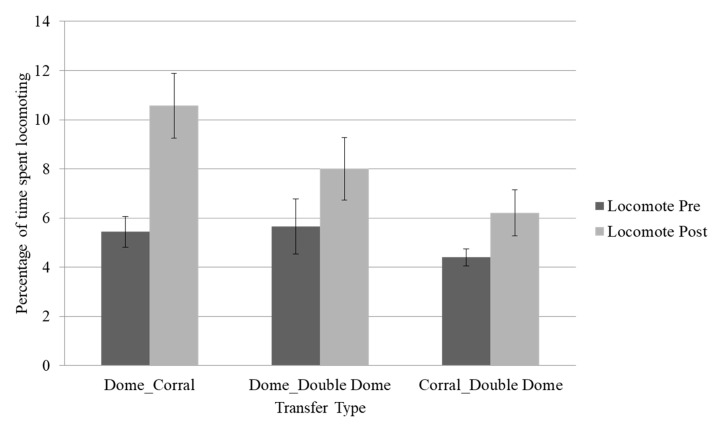
Figure 1.
Mean percentage of time spent locomoting across the three transfer types. Error bars represent the standard error of the mean. Locomotion was trending higher post-transfer in the dome (~142 square feet per animal) to corral (~645 square feet per animal, p ≤ 0.08) and significantly higher in the dome to double dome (~284 square feet per animal, p ≤ 0.05) transfers, but not significantly so in the corral to double dome transfer (p > 0.10).

