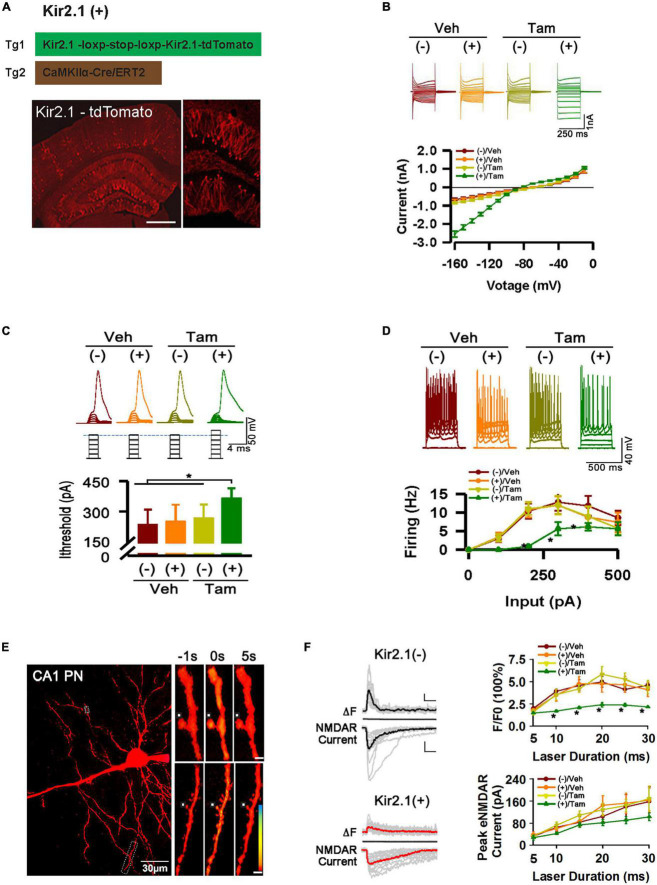
FIGURE 1.
Inhibition of forebrain excitatory neural activity in Kir2.1 knock-in mice. (A) A strategy for inducible expression of the Kir2.1 channel (Tg1) in the forebrain neurons by crossing a Tg1 line with a Cre/ERT2 transgenic line under control of CaMKIIα promoter (Tg2), and representative fluorescence images of Kir2.1-tdTomato protein in a sagittal section from the Kir2.1 (+) mice. Bar = 0.5 mm (B). The Kir2.1 currents are plotted against the holding potentials in CA1 pyramidal neurons from the Kir2.1 (+) and the Kir2.1 (–) mice. Traces above the plot are the example recordings from the individual mice. Data are mean ± SEM (n = 16 recordings/8 mice per group, ANOVA*p < 0.01). (C) The CA1 pyramidal neurons in the Kir2.1 (+) mice require more currents to elicit firing with a 2 ms current step. Top, examples of sub-threshold membrane depolarization and the first action potential elicited by current injection. Square pulses illustrate increasing current injection. Bottom, a bar graph shows the threshold currents required for action potential firing in CA1 pyramidal neurons from the Kir2.1 (+) and the Kir2.1 (–) mice. Data are mean ± SEM (n = 12 recordings/6 mice per group, ANOVA *p < 0.01). (D) Firing frequency is reduced in the Kir2.1 (+) mice. Top, examples of the CA1 pyramidal neuron firing trains in response to current injection. Bottom, firing frequency is plotted against current injection (500 ms duration, 0 to 500 pA, 50 pA steps). Data are mean ± SEM (n = 12 recordings/6 mice per group, ANOVA*p < 0.01). (E) Morphological features of a recorded CA1 pyramidal neuron filled with 50 μM Fluo-5F. Box indicates a dendritic segment used for Ca2+ image. Ca2+ transient in the dendrite was induced by glutamate uncaging. Each image is an average of 6–8 frames taken 1 s before and 5 s after glutamate uncaging (0 s), as indicated. (F) Reduction in the peak amplitudes of the dendritic spine Ca2+ transients in the Kir2.1 (+) mice. Representatives are the individual traces (gray lines) and averaged responses (black and red lines) recorded in the Kir2.1 (–) mice and Kir2.1 (+) mice. Time courses of fluorescence changes and the NMDA receptor-mediated currents induced by glutamate uncaging recorded in the slices from the Kir2.1 (+) and the Kir2.1 (–) mice. Data are mean ± SEM (n = 12 recordings/6 mice per group, ANOVA*p < 0.01). Bar: 200% and 50 pA. In this Figure, the experiments were performed in the Kir2.1 (+) and the Kir2.1 (–) mice 2 days after 5 consecutive days of vehicle or tamoxifen administration.

