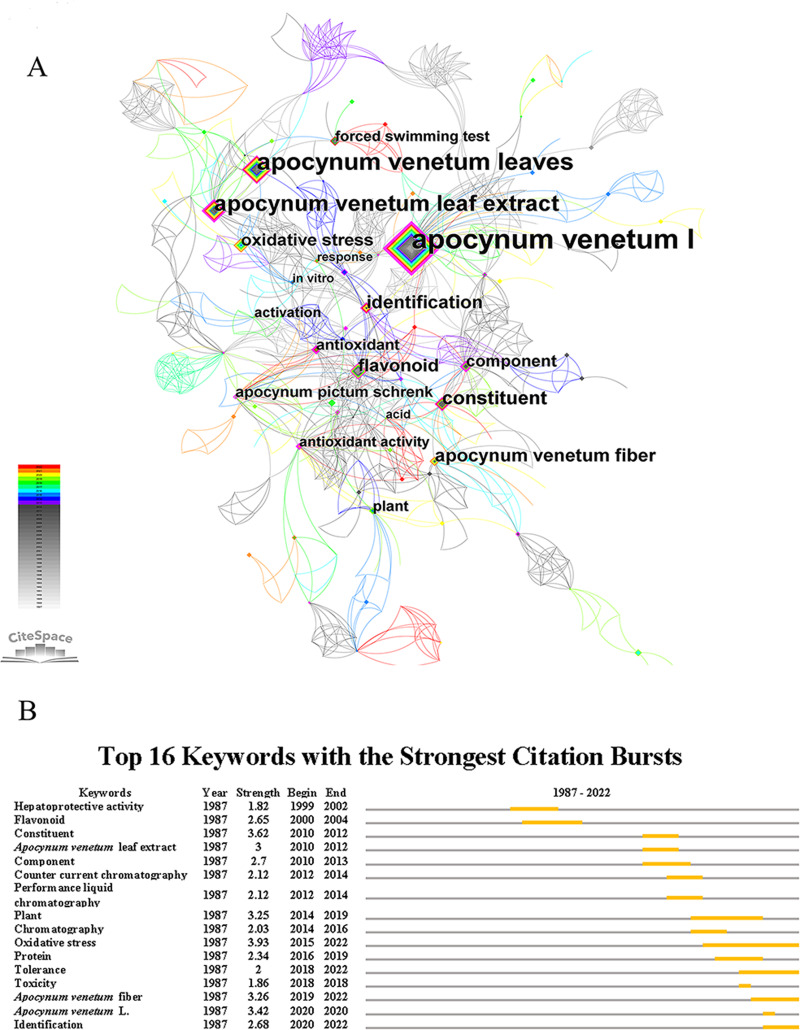
Figure 2. Keywords analysis of A. venetum.
(A) Nodes in the network represent keywords. Node size represents the number of keyword occurrences. Node color: average time to appear, color from white to red, time from 1987 to 2022. (B) Top 16 keywords with the strongest citation bursts. The grey line represents time interval, the yellow line indicates time period in which a keyword was found to have a burst.

