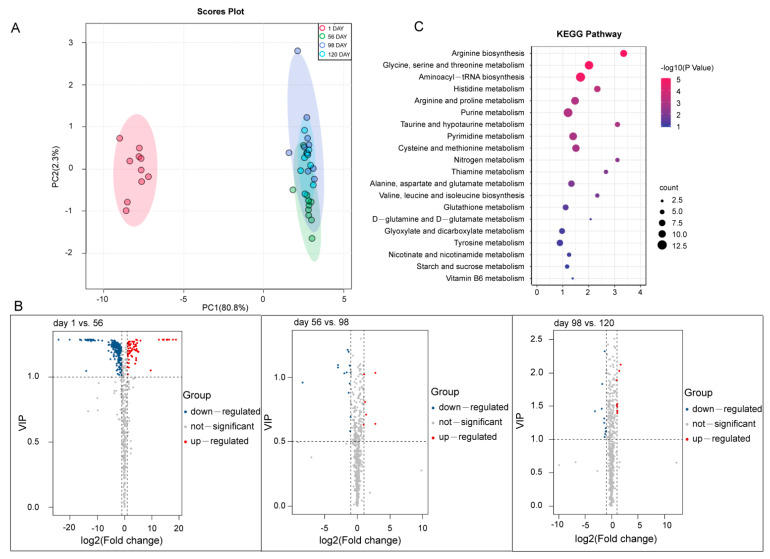
Figure 3.
Analysis of metabolites of breast muscle at four developmental stages of Beijing-You chicken (BJY). (A) Principal component analysis (PCA) of the identified metabolites. The X axis represents PC1 and the Y axis represents PC2. Each sample had ten biological replicates. (B) Significantly changed metabolites (SCMs) between different stages. (C) The top 25 significant terms of SCMs by KEGG analysis.

