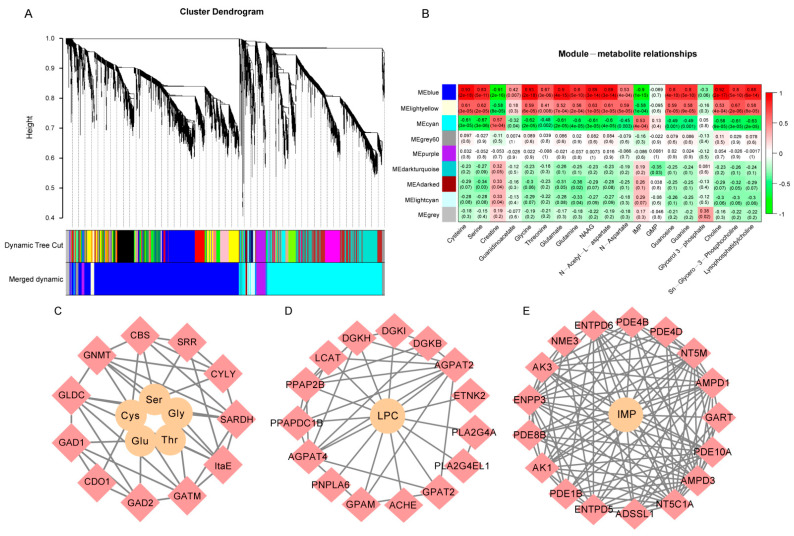
Figure 4.
Joint analysis of significantly changed metabolites (SCMs) and differentially expressed genes (DEGs) of breast muscle at four developmental stages of Beijing-You chicken (BJY). (A) Nine clustering modules with different expression trends of DEGs obtained by overweighted gene co-expression network analysis (WGCNA). The dendrogram shows DEG co-expression clusters. Different colors indicate DEG co-expression modules. (B) Heatmap showing module–metabolite relationships. Each row represents a different modules obtained from the WGCNA analysis. Each column represents a metabolite. Red indicates that there was a positive correlation between this cluster and the metabolite, and green indicates a negative correlation. The numbers in the module indicate the corresponding p-value and correlation coefficient. (C) Interaction network of amino acids and DEGs by cytoscape. Yellow circles represent amino acids. Pink diamonds represent DEGs involved in amino acids metabolism. (D) Interaction network of lysophosphatidylcholine (LPC) and DEGs. Yellow circles represent LPC. Pink diamonds represent DEGs involved in LPC biosynthesis. (E) Interaction network of inosine monophosphate (IMP) and DEGs. Yellow circles represent IMP. Pink diamonds represent DEGs involved in IMP biosynthesis.

