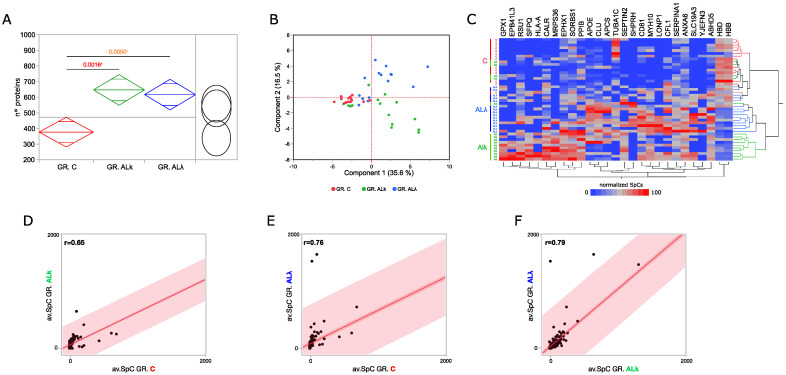
Figure 2.
Proteomics analysis of abdominal sub-cutaneous adipose tissues from control subjects and patients affected by AL amyloidosis. (A) Comparison among the average number of proteins identified in control subjects (C, n = 14) and patients affected by AL amyloidosis (AL, n = 15; AL, n = 15); ANOVA and Tukey’s test (* p ≤ 0.05). (B) Principal component analysis (PCA) by processing proteins differentially abundant (DAPs) in C, AL and AL groups. (C) Hierarchical clustering and heat map showing the high-confidence DAPs in C, AL and AL protein profiles (LDA, p ≤ 0.01). (D) Spearman’s correlation using DAPs and the corresponding average SpC values in C and AL, (E) C and AL, and (F) AL and AL groups.

