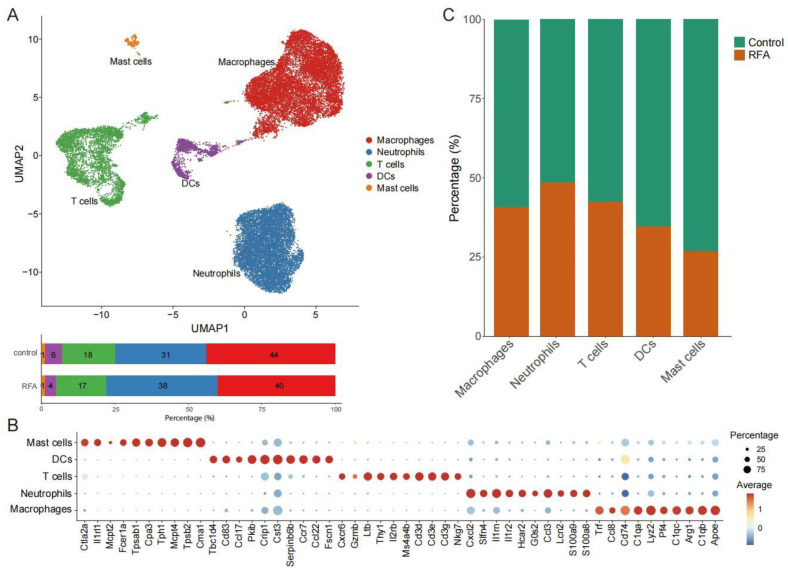
Figure 1.
scRNA-seq identifies the changes in tumor-infiltrating immune cells. (A). UMAP plot showing CD45+ immune cells colored by computationally determined clusters based on scRNA-seq data in the Panc02 tumor-bearing mouse model (above). The frequencies of cell composition in the tumor-infiltrating CD45+ immune cells with the control group (not subjected to ablation, n = 14,837) and ablation group (n = 11,247) (below). (B). Dotplot showing the top 10 marker genes across five different CD45+ immune cell subgroups. (C). Percentages of cells in the control group and ablation group among the different cell subgroups of CD45+ immune cells.

