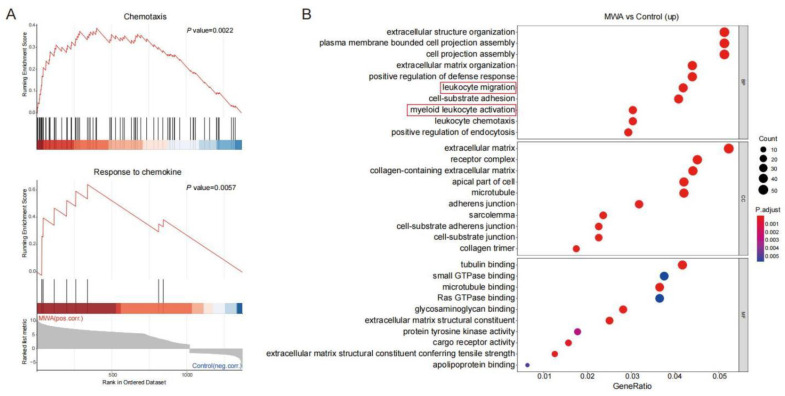
Figure 2.
Enrichment analysis of DEGs in CD8+TILs after MWA treatment. (A). GSEA analysis showing the top enriched chemotaxis and chemokine-mediated signal transduction regulatory pathways in CD8+TILs of the MWA treatment group. (B). GO enrichment analysis of up-regulated genes in CD8+TILs of the MWA treatment group.

