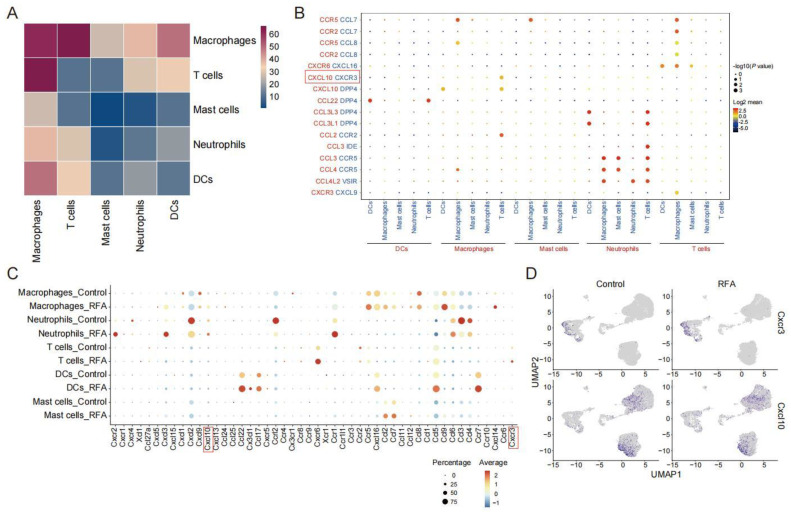
Figure 3.
CXCL10-CXCR3 plays a vital role in ablation-induced cell–cell interactions. (A). Heatmap showing the cell–cell communication among immune cell populations between subgroups of CD45+ immune cells predicted by CellphoneDB2. (B). Dotplot showing the expression intensity of selected ligand–receptor pairs among the different cell subgroups of CD45+ immune cells. Sizes of dots represent the p-value, and colors of dots represent the strength interaction between two subpopulations. (C). Dotplot showing the expression levels of chemokines and its receptors across cell types in the control and ablation treatment groups. (D). UMAP plot showing expressions of chemokine Cxcl10 and its receptor Cxcr3 in two groups.

