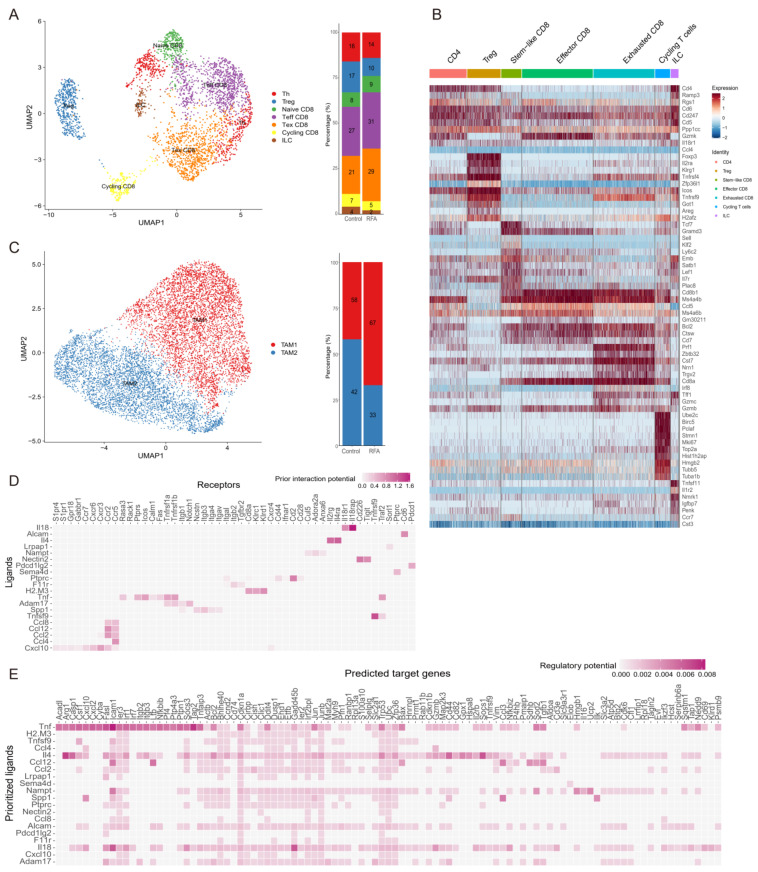
Figure 4.
Ablation leads to the remodeling of tumor-infiltrating CD45+ immune cell subsets. (A). UMAP plot showing sub-clusters of T cells based on scRNA-seq data in the Panc02 tumor-bearing mouse model (left). The frequency of cell composition in the T cells of the control group (n = 2042) and ablation group (n = 1480) (right). (B). Heatmap displaying marker genes expressed in different subpopulations of TILs. (C). UMAP plot showing sub-clusters of macrophages colored by computationally determined clusters (left). The frequency of cell composition in the macrophages of the control group (n = 5860) and RFA group (n = 4153) (right). (D). Heatmaps showing potential ligands from macrophages interacting with receptors expressed on CD8+T cells on the non-ablation side in the ablation group. (E). Heatmaps showing that potential ligands from macrophages might influence the gene expression in CD8+T cells of the RFA group.

