Figure 7.
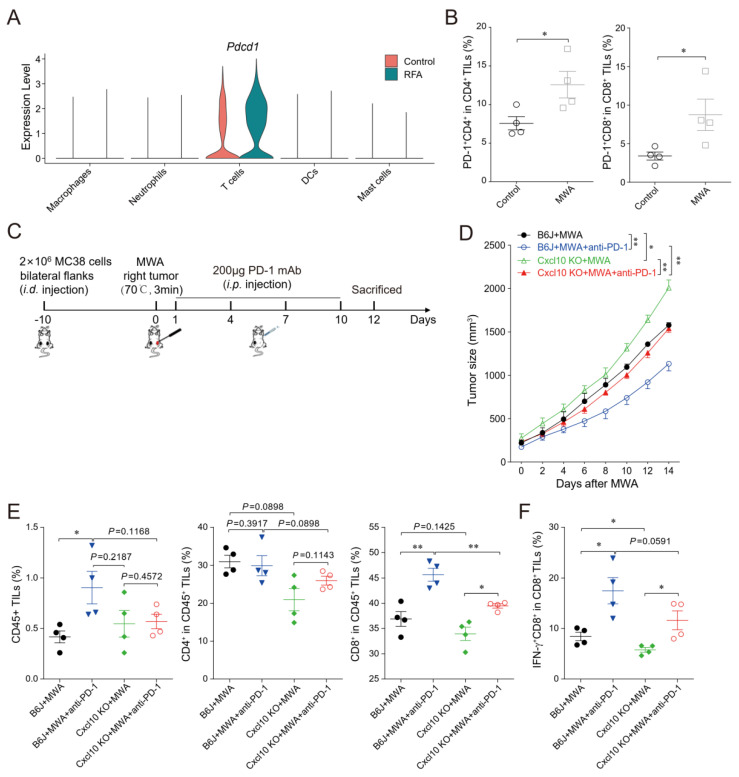
CXCL10 contributes to the synergy of MWA and PD-1 blockade. (A). Normalized expression of Pdcd1 gene in the lymphocyte subsets shown by the violin plot. (B). The percentage of PD-1 in CD4+TILs and CD8+TILs on day 12 of MWA in the MC38 tumor-bearing mouse model dosed with control or MWA treatment. (C). Schematic drawing of the study. C57BL/6 and Cxcl10−/− mice were bilaterally inoculated with MC38 cells on the back to construct tumor-bearing mouse models, and one side of the tumor was treated with MWA. Mice were injected i.p. with isotype control or anti-PD-1 antibody on day 1 after MWA and then every 3 days four times. (D). The size of the tumors on the non-MWA area tumor was recorded every 2 days after MWA. Five mice were in each group. (E). Flow cytometric analysis of the percentages of CD45+ tumor-infiltrating cells, CD4+TILs, and CD8+TILs of C57BL/6 and Cxcl10−/− mice treated with control or MWA treatment (n = 4). (F). Representative flow cytometry plots and quantitation of the percentage of IFN-γ expression in CD8+TILs (n = 4). Data are represented as the mean ± SEM. * p < 0.05 and ** p < 0.01 according to the one-way ANOVA test and the log-rank test.

