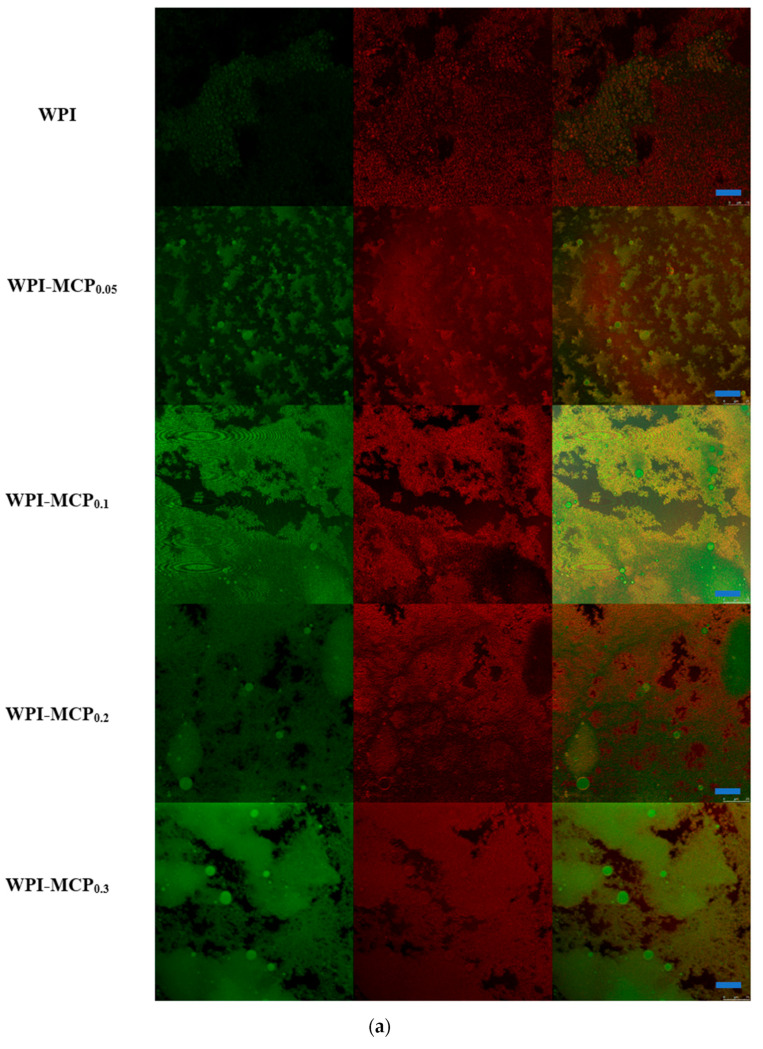
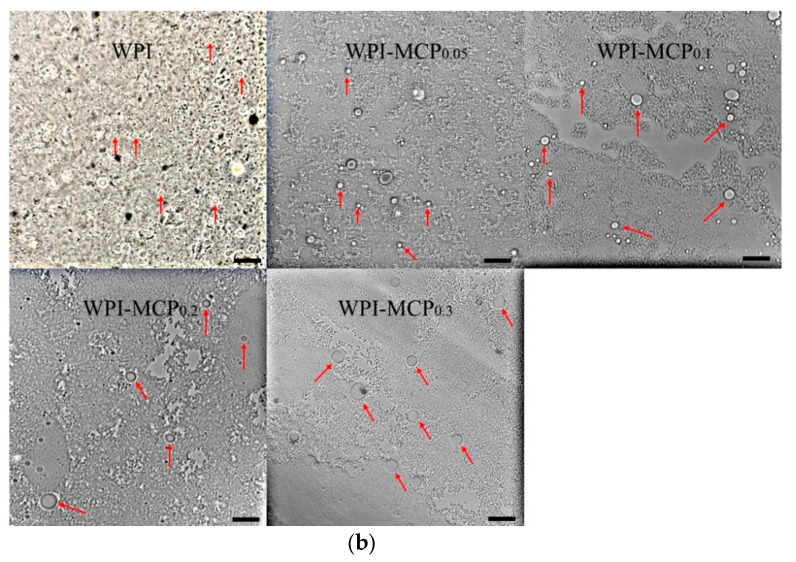
Figure 3.
Typical CLSM (a) and light microscope images (b) of the emulsions stabilized by WPI (2%, w/v) with different concentration of MCP from 0 to 0.3% (w/v). For (a), from left to right were corn oil staining with Nile red, protein staining with Nile blue, and the combined images, respectively. The blue bars in (a) and black bars in (b) represent 25 μm and 20 μm in scale. The red arrows mark emulsion droplets.


