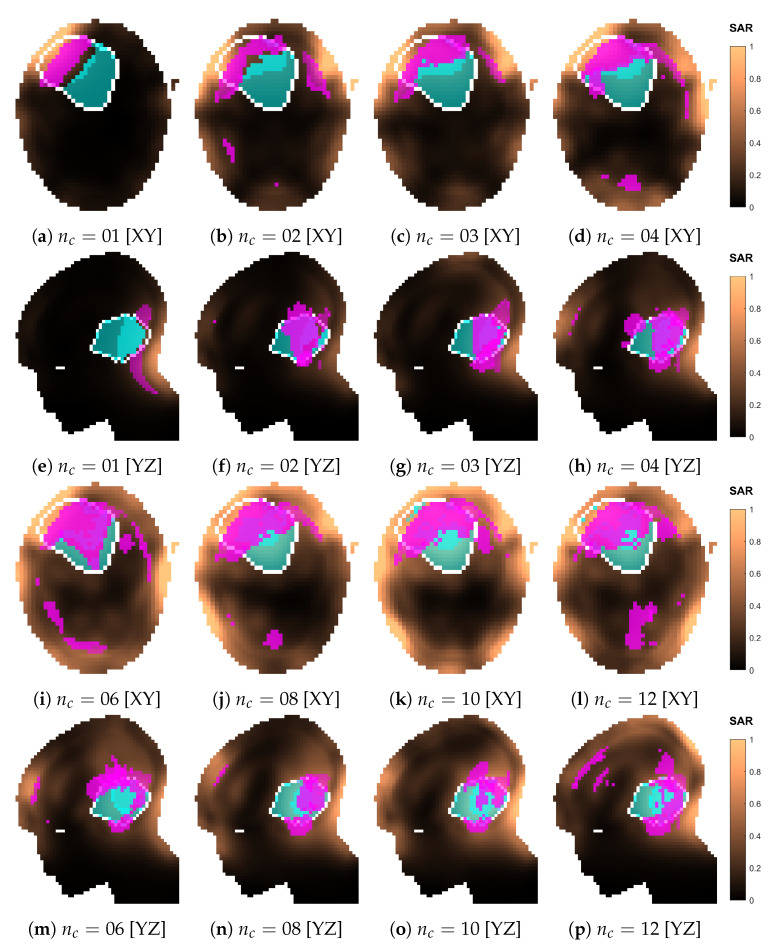
Figure 16.
Normalized SAR distributions relative to each optimized applicator design with increasing number of antenna elements (). Sections taken at target center. The white line delineates the target volume. The volumes in magenta represent the highest q-percentile () in the remaining healthy tissue (hot spot), while the volumes in cyan represent the lowest p-percentile () in the target (cold spot).

