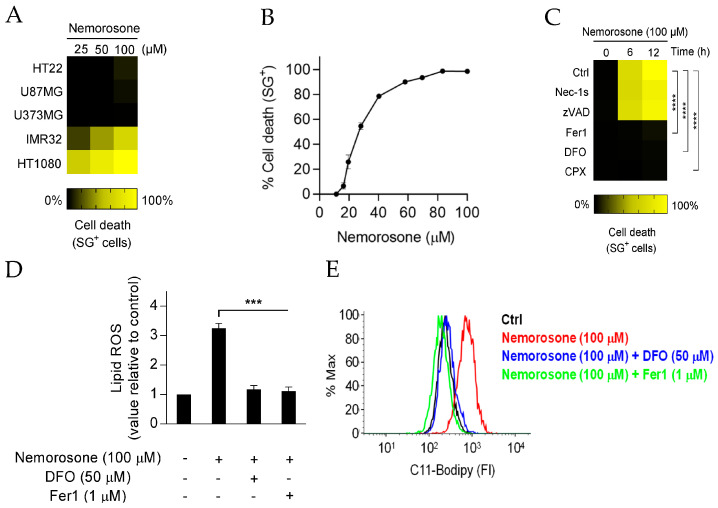
Figure 1.
High cytotoxicity of nemorosone in human fibrosarcoma cell line HT1080 is due to ferroptosis induction. (A) Heatmap showing the sensitivity to cell death of different cancer and non-tumorigenic cell lines after exposure to various concentrations of nemorosone: HT22 (mouse hippocampal neuronal cell line), U87MG and U373MG (human glioblastoma cell lines), IMR-32 (human neuroblastoma cell line), and HT1080 (human fibrosarcoma cell line). Cell lines were incubated with nemorosone for 24 h. (B) Cytotoxic dose-response curve in HT1080 cells 12 h after nemorosone treatment. (C) Heatmap showing the sensitivity to cell death of HT1080 cells after being exposed to 100 μM of nemorosone, with or without the following inhibitors: the RIPK1-kinase inhibitor necrostatin-1 (Nec-1s, 10 μM), the pan-caspase inhibitor Z-VAD-FMK (10 μM), and the ferroptosis inhibitors ferrostatin-1 (Fer1, 1 μM), deferoxamine (DFO, 50 μM), and ciclopirox olamine (CPX, 5 μM). (D) Analysis using flow cytometry of the C11-BODIPY lipid peroxidation sensor in live HT1080 cells (DRAQ7-negative cells) following nemorosone treatment (100 μM, 4 h). Ferroptosis inhibitors: DFO (50 μM) and Fer1 (1 μM). (E) Flow cytometry analysis (histogram) of the lipid peroxidation sensor (C11-BODIPY-581/591 dye) on live-gated HT1080 cells (DRAQ7-negative cells) after treatment with nemorosone (100 μM, 4 h) and its combination with the ferroptosis inhibitors DFO (50 μM) and Fer1 (1 μM). FI is the fluorescent intensity. Traces are representative of three independent experiments. All quantitative data are shown as mean ± SD from three separate experiments. *** p < 0.001 and **** p < 0.0001 determined by unpaired Student’s t-test.

