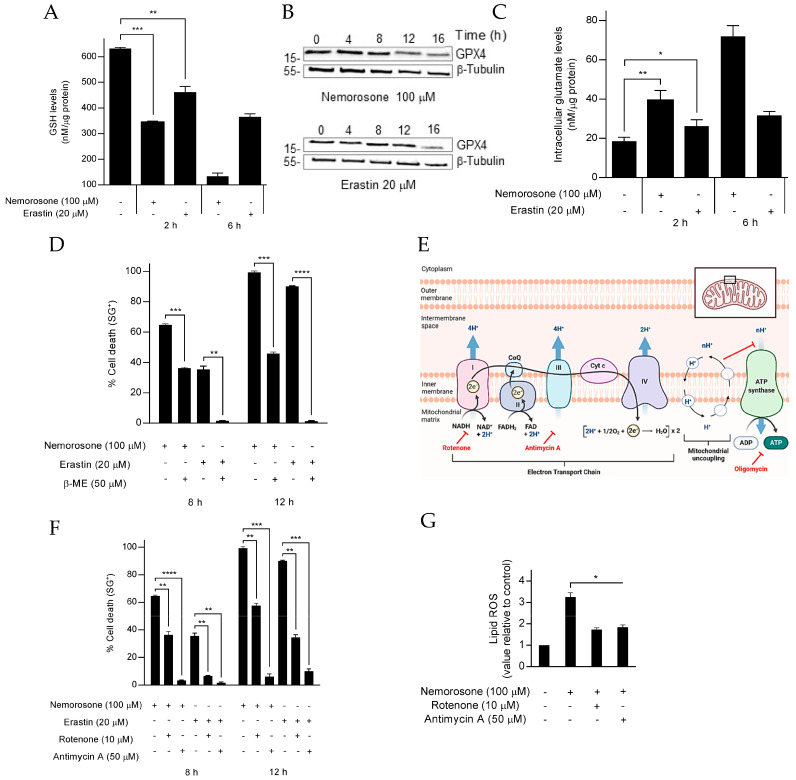
Figure 2.
Nemorosone acts as a class I ferroptosis-inducing compound. (A) GSH levels in HT1080 cells treated with nemorosone (100 μM) or erastin (20 μM). (B) Western blot analysis of the expression of GPX4 and β-tubulin in HT1080 cells after treatment with nemorosone (100 μM) or erastin (20 μM). (C) Intracellular glutamate levels in HT1080 cells treated with nemorosone (100 μM) or erastin (20 μM). (D) Percentage of cell death at different time points induced by nemorosone (100 μM) or erastin (20 μM) in HT1080 cells, assessed using SytoxGreen dye, in the absence or presence of β-mercaptoethanol (β-ME, 50 μM). (E) Schematic representation of some inhibitors of the mitochondrial oxidative phosphorylation. Electrons from substrates pass through complexes I to IV of the electron transport chain. Protons (H+) are pumped into the intermembrane space using the energy generated by this process. The resulting proton gradient is used to drive ATP synthesis. This figure was created with BioRender.com (accessed on 17 July 2022). (F) Percentage of cell death induced by nemorosone (100 μM) and erastin (20 μM) in HT1080 cells, assessed using SytoxGreen dye, in absence or presence of the subsequent electron transport chain inhibitors: rotenone (10 μM) and antimycin A (50 μM). (G) Analysis using flow cytometry of the C11-BODIPY lipid peroxidation sensor in live HT1080 cells (DRAQ7-negative cells) following nemorosone treatment (100 μM, 4 h). Electron transport chain inhibitors: rotenone (10 μM) and antimycin A (50 μM). All quantitative data are shown as mean ± SD from three separate experiments. * p < 0.05, ** p < 0.01, *** p < 0.001, **** p < 0.0001 determined by unpaired Student’s t-test.

