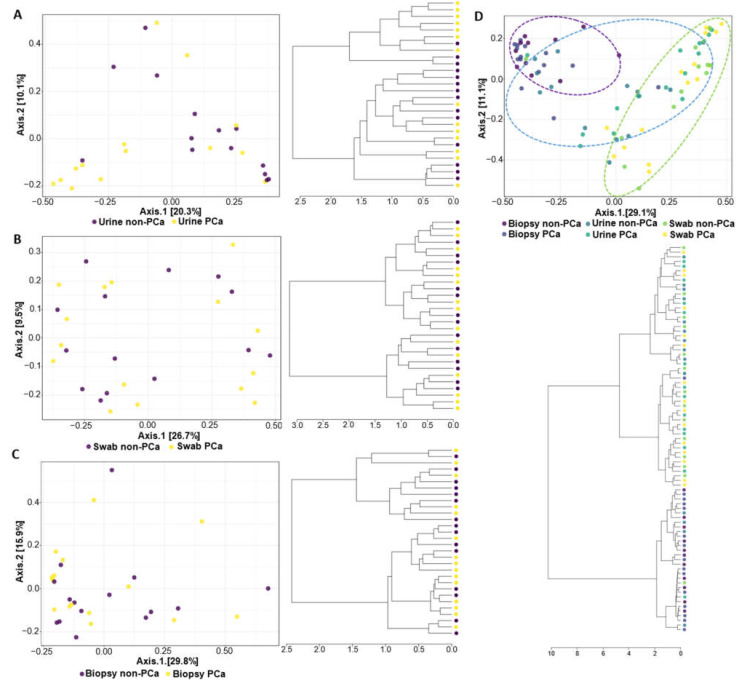
Figure 2.
The β-diversity metrics (PCoA on the top and hierarchical cluster on the bottom) for PCa and non-PCa groups were categorized by (A) urine, (B) glans, (C) prostate biopsies, and (D) all combined samples. The blue, green, and purple ellipses represent the urine, glans, and biopsy samples, respectively.

