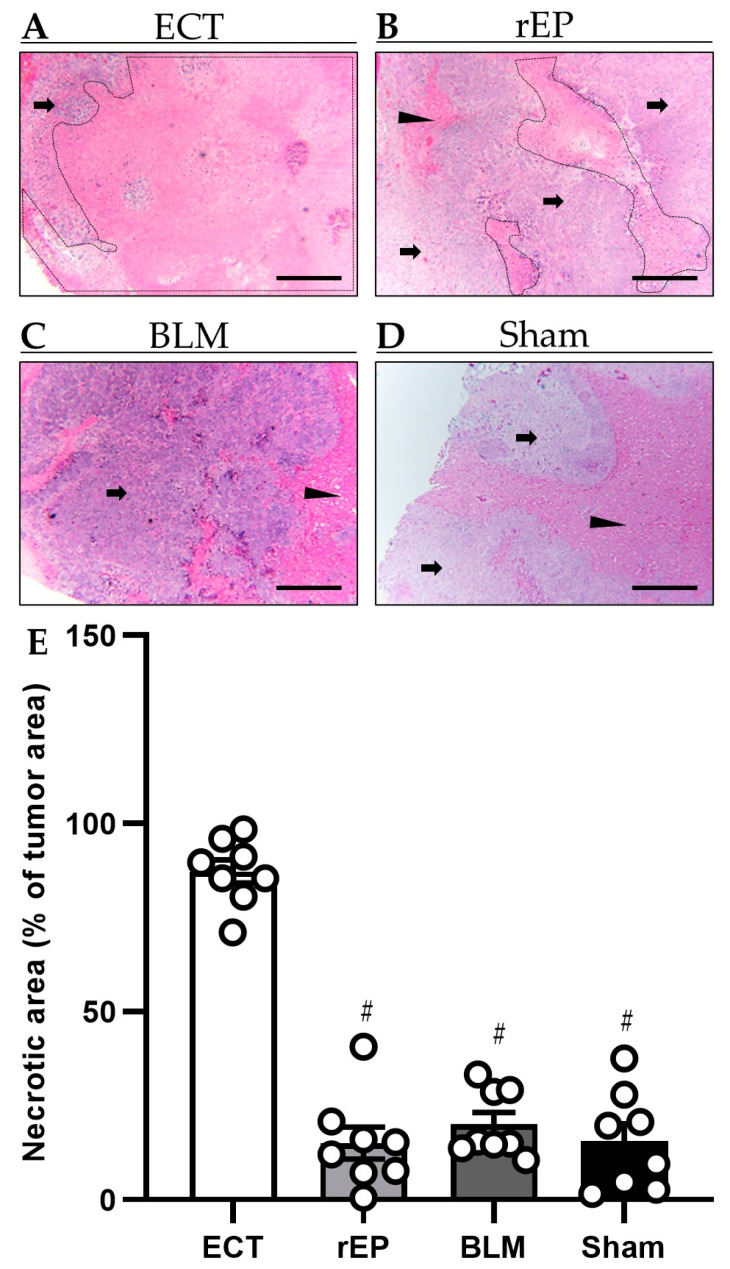
Figure 3.
(A–D) Histological analysis of necrotic cell death (borders marked by dotted line) in animals treated with ECT (A), rEP (B), BLM (C), or Sham (D). Tumor tissue is marked by arrows and normal hepatic tissue by arrowheads. Scale bars: 500 µm. (E) Necrotic areas in the tumor tissue were measured as percentage of the whole tumor area. Data are given as mean ± SEM; # p < 0.05 vs. ECT.

