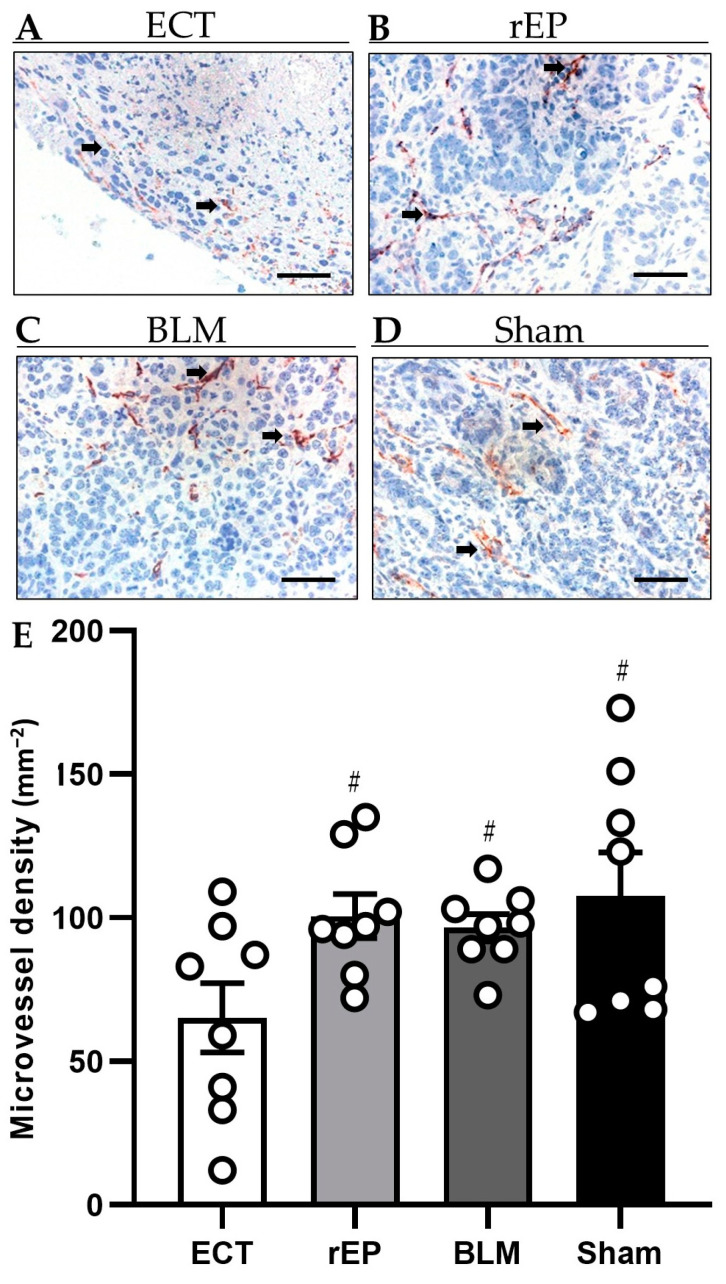
Figure 6.
(A–D) Immunohistochemical analysis of CD31 expression in the tumor tissue of animals treated with ECT (A), rEP (B), BLM (C), and Sham (D). CD31-positive blood vessels (arrows) are stained red. Scale bars: 50 µm. (E) The diagram shows the quantitative analysis of CD31-positive blood vessels in tumor tissues. The microvessel density is given as the mean number of positive vessels (in 10 HPF) in mm−2; # p < 0.05 vs. ECT.

