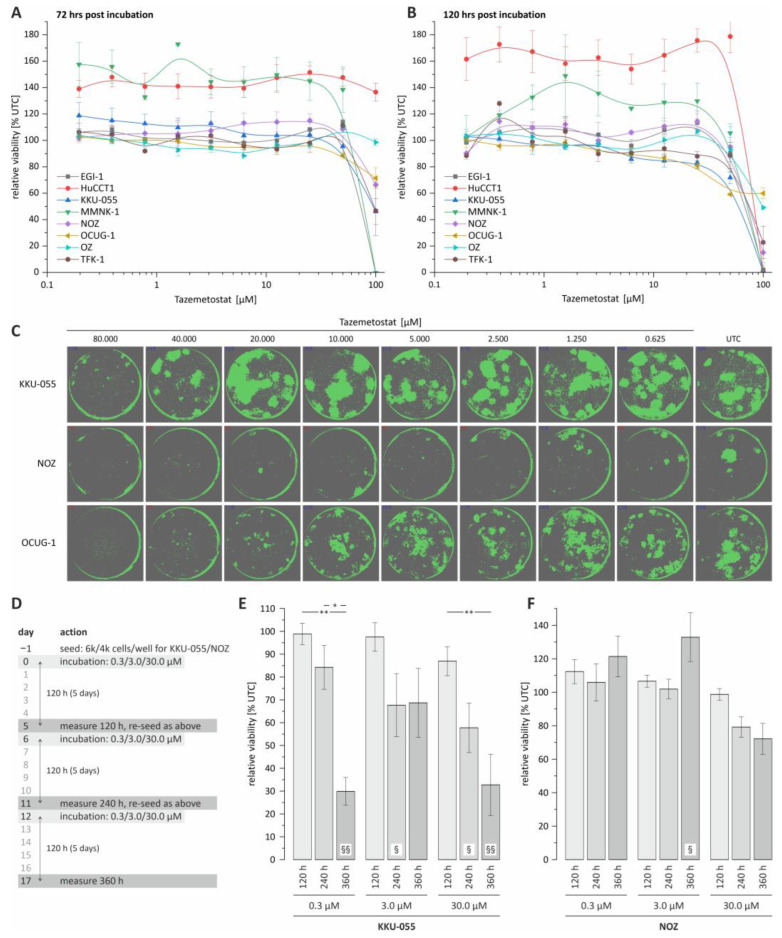
Figure 1.
Cell viability and colony formation analysis of BTC cell lines following tazemetostat treatment. (A) Cell viability of 8 BTC cell lines following tazemetostat treatment for 72 h; (B) cell viability of 8 BTC cell lines following tazemetostat treatment for 120 h; (C) representative images of colony formation after treatment with tazemetostat for 7 d (KKU-055, NOZ and OCUG-1); (D) protocol of performing cell viability analysis for up to 360 h with tazemetostat treatment; (E) cell viability analysis of KKU-055 after 120 h, 240 h and 360 h with 0.3, 3 and 30 µM tazemetostat; (F) cell viability analysis of NOZ after 120 h, 240 h and 360 h with 0.3, 3 and 30 µM tazemetostat. * = significant p < 0.05; ** highly significant p < 0.01 between different time points of the same concentration. § = significant p < 0.05, §§ = highly significant p < 0.01 between selected time point and the untreated control of the same concentration; UTC = untreated control.

