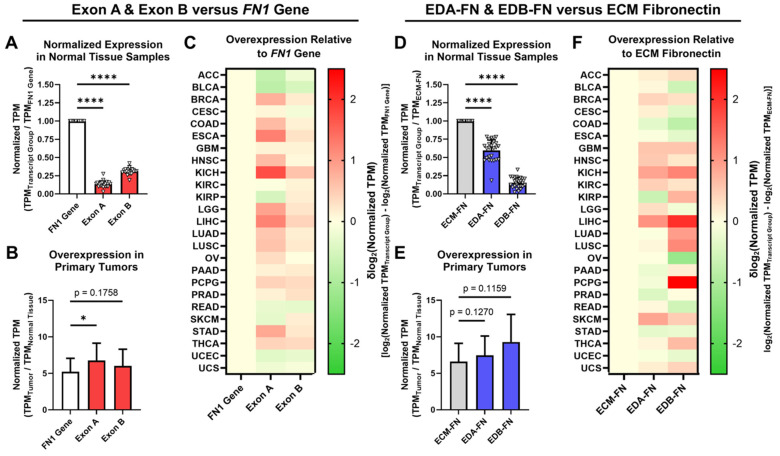
Figure 4.
Expression of oncofetal FN in normal tissues and primary tumors. (A) Average expression of Exon A and Exon B normalized to the FN1 gene in normal tissue samples (n = 25). (B) Average overexpression of the FN1 gene, Exon A, and Exon B in primary tumors normalized to corresponding normal tissues (n = 25). (C) Heat map showing overexpression of Exon A and Exon B normalized to the FN1 gene by cancer type. (D) Average expression of EDA-FN and EDB-FN normalized to ECM-FN in normal tissue samples (n = 25). (E) Average overexpression of ECM-FN, EDA-FN, and EDB-FN in primary tumors normalized to corresponding normal tissues (n = 25). (F) Heat map showing overexpression of EDA-FN and EDB-FN normalized to ECM-FN by cancer type. Tissue types were excluded from analysis if the number of samples in any cohort was fewer than 10. Significance: *, p < 0.05; ****, p < 0.0001.

