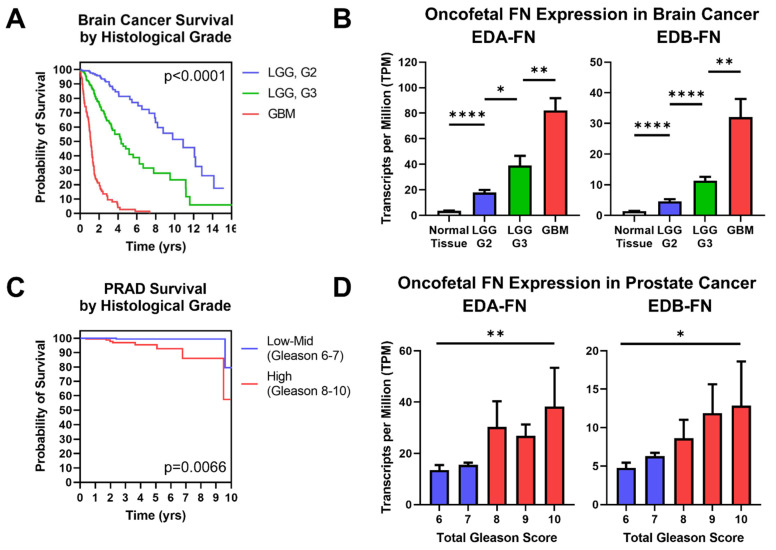
Figure 7.
Oncofetal FN expression and histological grade. (A) Kaplan–Meier survival curves for brain cancers separated out by histological grade (LGG G2, n = 247; LGG G3, n = 260; GBM, n = 152). The colors of the curves correspond to the column graphs in (B). (B) Oncofetal fibronectin expression in brain cancers and corresponding normal tissue (n = 1152), separated out by histological grade (LGG G2, n = 247; LGG G3, n = 260; GBM, n = 152). Glioblastoma multiforme was considered the highest grade of brain cancer. (C) Kaplan–Meier survival curves for prostate cancer of low–mid grade (Gleason score 6–7; n = 271) and high grade (Gleason score 8–10; n = 191). Groups were combined for sample size purposes. The colors of the curves correspond to the column graphs in (D). (D) EDB-FN expression in prostate cancer separated out by total Gleason score (6, n = 43; 7, n = 228; 8, n = 57; 9, n = 131; 10, n = 4). Statistical analysis for prostate cancer data used the Kruskal–Wallis test. Significance: *, p < 0.05; **, p < 0.01; ****, p < 0.0001.

