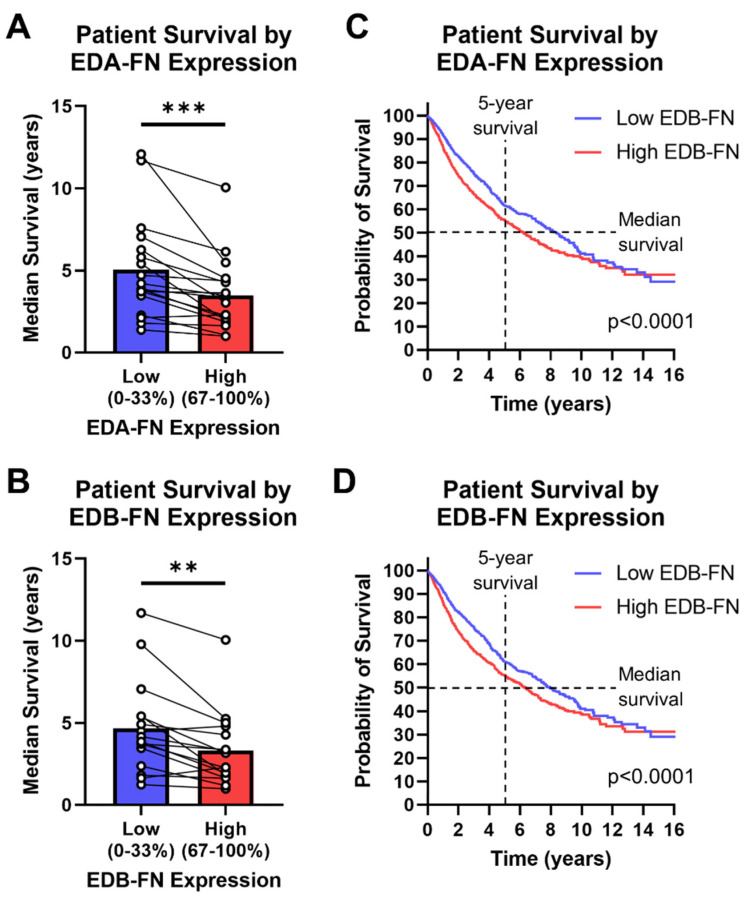
Figure 8.
Oncofetal FN expression and patient prognosis. Median patient survival time based on high (top 33%) or low (bottom 33%) (A) EDA-FN (n = 18) and (B) EDB-FN (n = 16) expression within each cancer type. Pan-cancer Kaplan–Meier survival curves comparing patients expressing low and high levels of (C) EDA-FN (low, n = 3055; high, n = 3055) and (D) EDB-FN (low, n = 3051; high, n = 3046). Low- and high-expression groups were determined within each cancer type before being combined into a single dataset. Significance: **, p < 0.01; ***, p < 0.001.

