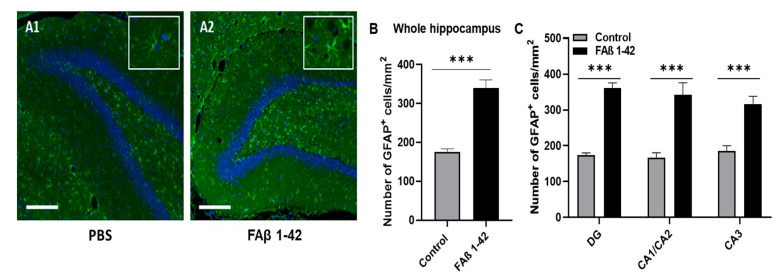
Figure 2.
Quantification of GFAP+ astrocytes in the hippocampal areas. Brain sections from rats infused with FAβ1–42 (1 µg/µL) or PBS solutions were analyzed 14 days post-injection. (A1,A2) Representative immunohistochemical staining of GFAP expression (in green) in the DG area. The slides were counterstained with DAPI (blue). Scale bar, 500 µm. The box corresponds to GFAP staining with a higher magnification (B) Histograms showing the number of GFAP + cells per mm2 quantified in the total hippocampus and (C) in each area of the hippocampus (CA1/CA2, CA3 and DG). The quantification of GFAP + cells was analyzed in 4–5 sections per animal (n = 5 for each group). Statistical comparisons between both groups were analyzed using a Student’s t-test. *** p ≤ 0.001.

