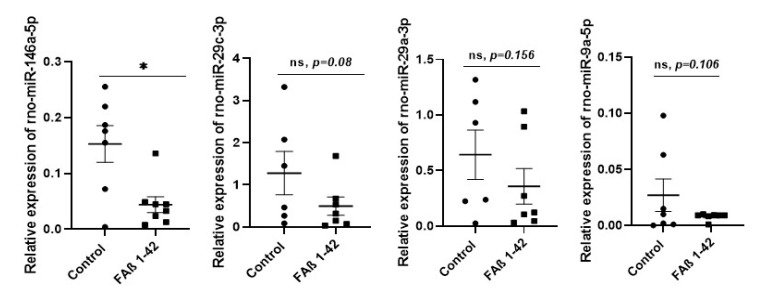
Figure 3.
Relative expression of circulating miRNA-146a-5p, miRNA-29a-3p, miRNA-9a-5p, miRNA-29c-3p in serum samples of rats infused with 1 µg/µL of FAβ1–42 peptides solution. Sera from rats infused with FAβ1–42 peptides (treated group) or PBS (control group) solutions were collected 21 days post-infusion. MiRNA were extracted and quantified by qRT-PCR. Data are represented as mean ± SEM of 7–8 samples evaluated in triplicate. Statistical comparisons between FAβ1–42 and PBS group were performed using the Mann–Whitney test * p ≤ 0.05.

