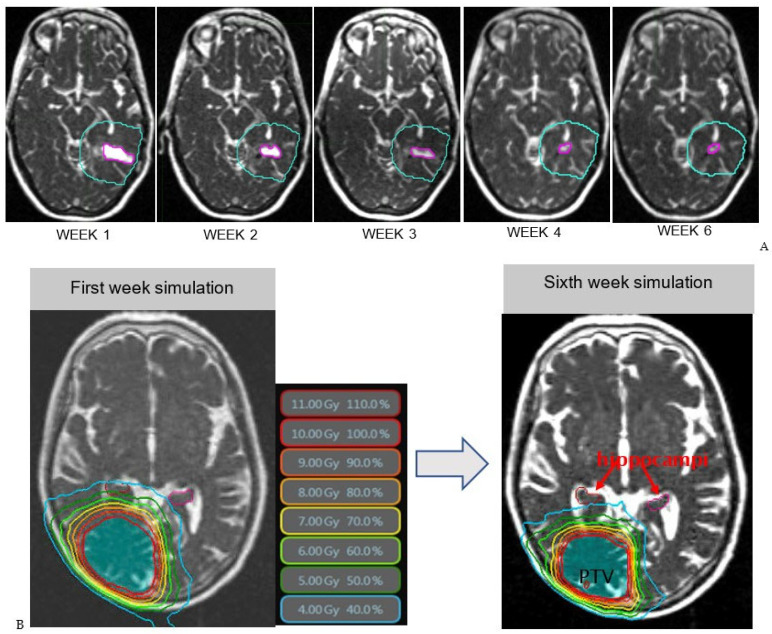
Figure 3.
(A): Resection cavity shrinkage visualized on MRI–Linac: T2-weighted bSSFP treatment set-up scans This shows the PTV and RC volume trending downwards as the weeks progressed. Week 1: Volume of RC is 3.0 mL and mean dose to brain is 3.3 Gy. Week 2: Volume of RC is 1.3 mL and dose to brain is 2.7 Gy. Week 3: Volume of RC is 0.8 mL and dose to brain is 2.7 Gy. Week 4: Volume of RC is 0.6 mL and dose to brain is 2.5 Gy. Week 6: Volume of RC is 0.5 mL and dose to brain is 2.5 Gy. (B): Example adaptive replanning comparing the dose distribution for the first week of treatment (left) and the dose distribution for the sixth week (right). Isodose lines are shown in color surrounding the PTV (area shaded in blue). Both left and right hippocampi are contoured, shown in pink (left) and red (right). During the first week of treatment, the 4 Gy isodose line (light blue) completely covers the right hippocampus. Comparing the 4 Gy isodose line between the two scans, at Week 6, this line has reduced radius sparing the right hippocampus from radiation dose. The dose also decreases to healthy tissue surrounding the PTV outside of the hippocampi.

