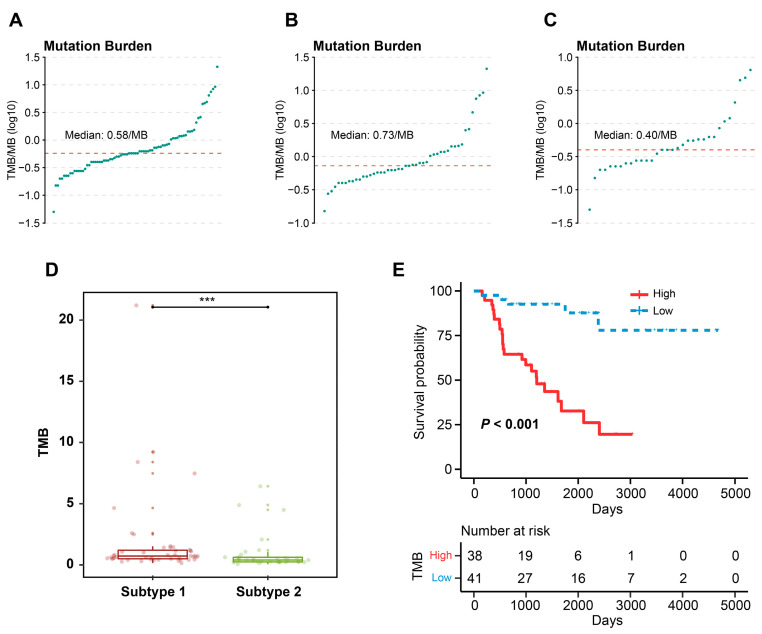
Figure 9.
TMB profile and TME-related subtypes. (A) The distribution of TMB of TCGA-ACC patients. (B) The distribution of TMB of subtype 1. (C) The distribution of TMB of subtype 2. (D) Comparison of the differences in TMB between two subtypes. (E) KM curves of OS for high- and low-TMB groups. Data in (D) was analyzed by Wilcoxon test; *** p < 0.001.

