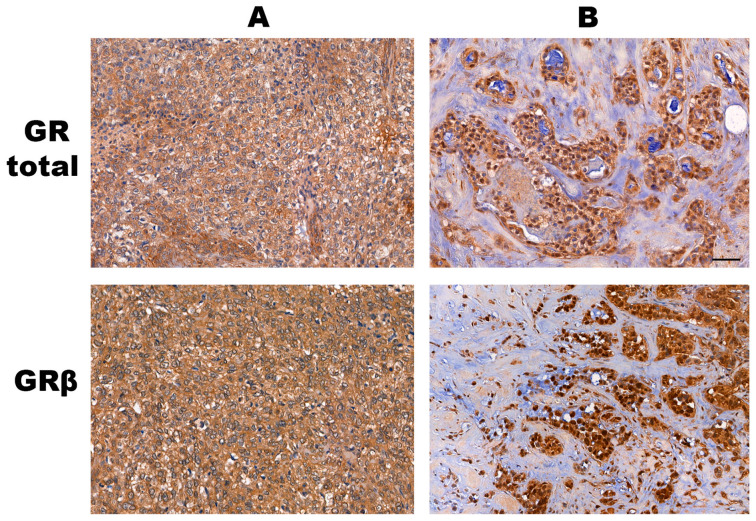
Figure 5.
Examples of the cytoplasmic (panel A) and mixed cytoplasmic+nuclear (panel B) staining patterns of the GRtotal and GRβ proteins. In Panel B, some nuclei are positive and some of them are negative for staining in the tumour tissue. The line indicates 50 μm. On this representative image, all tumours are of the triple-negative subtype.

