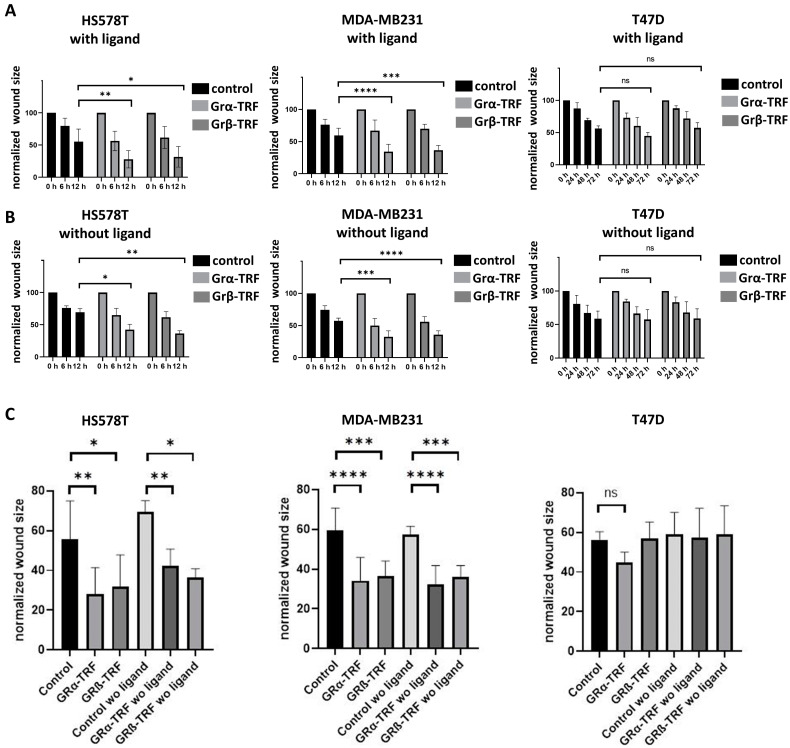
Figure 9.
Time-lapse (A,B) and comparative (C) results of cell migration of triple-negative ((A) HS578T and (B) MDA-MB231) and ER+ breast cancer cells ((C) T47D) following GRα and GRβ overexpression in the presence and the absence of the ligand. *: p < 0.05; **: p < 0.01; ***: p < 0.001; ****: p < 0.0001; ns: not significant.

