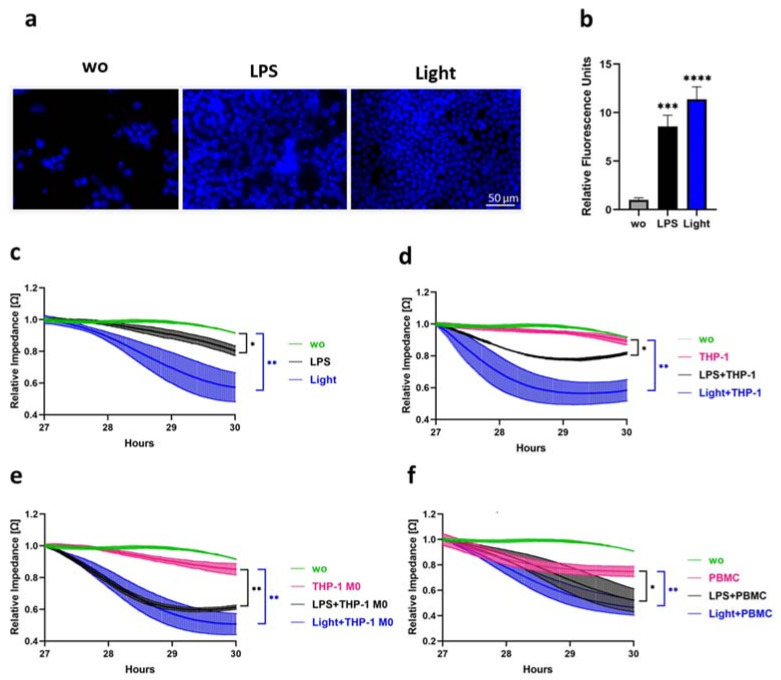
Figure 6.
Chemotactic and trans-endothelial migration. (a,b) THP-1 cells stained with Hoechst 33342 were seeded in the upper chamber of (a) Transwell® 24-well permeable supports or (b) Transwell® 96-well permeable supports and allowed to migrate through the 5 µm pore-size filters for 2 h towards endothelial medium of opto-TLR4-LOV LECs stimulated with LPS (100 ng/mL), illuminated with blue light (470 nm), or left untreated for 6 h. Migrated THP-1 cells were (a) visualized by fluorescence microscopy or (b) measured by multiplate reader. (a) Scale bar = 50 µm. (b) Bar charts representing mean values ± standard deviation of the well scan of relative fluorescence units (n = 3). Post-ANOVA, multiple comparisons relative to the control were performed using Dunnett’s test (*** p < 0.001, **** p < 0.0001). (c–f) LPS-, blue light- and monocytic-cell-line-induced EC monolayer breakdown in opto-TLR4-LOV LECs. ECs were seeded onto ECIS arrays (96W20idf PET) and allowed to grow to a monolayer before being (c) treated with LPS (100 ng/mL), blue light (470 nm), or left untreated. Addition of 50,000 (d) THP-1 cells/well, (e) THP-1 M0 cells/well, or (f) PBMCs/well. (c–f) Changes in endothelial monolayer resistance, which is proportional to endothelial barrier function, were recorded in real time using the ECIS system (9600Z) and mean values ± standard deviation (n = 8) were plotted in a time-curve diagram. Post-ANOVA, multiple comparisons relative to the control 3 h after treatment (T30h) were performed using Dunnett’s test (* p < 0.05, ** p < 0.01).

