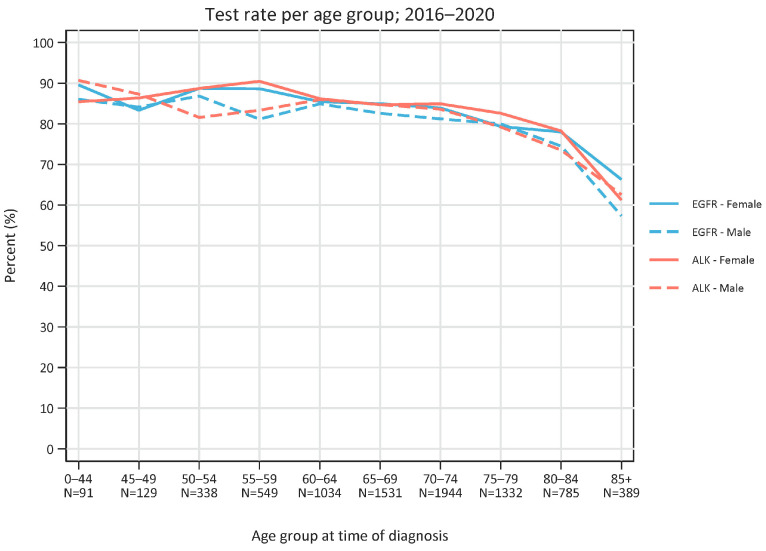
Figure 2.
Test rate (number of tests versus number of diagnosed non-squamous non-small cell lung cancer patients) per age group in the period 2013–2020. Total number of patients in each age group is depicted. Blue lines represent EGFR tests and red lines represent ALK tests. Solid lines represent females and dotted lines represent males.

