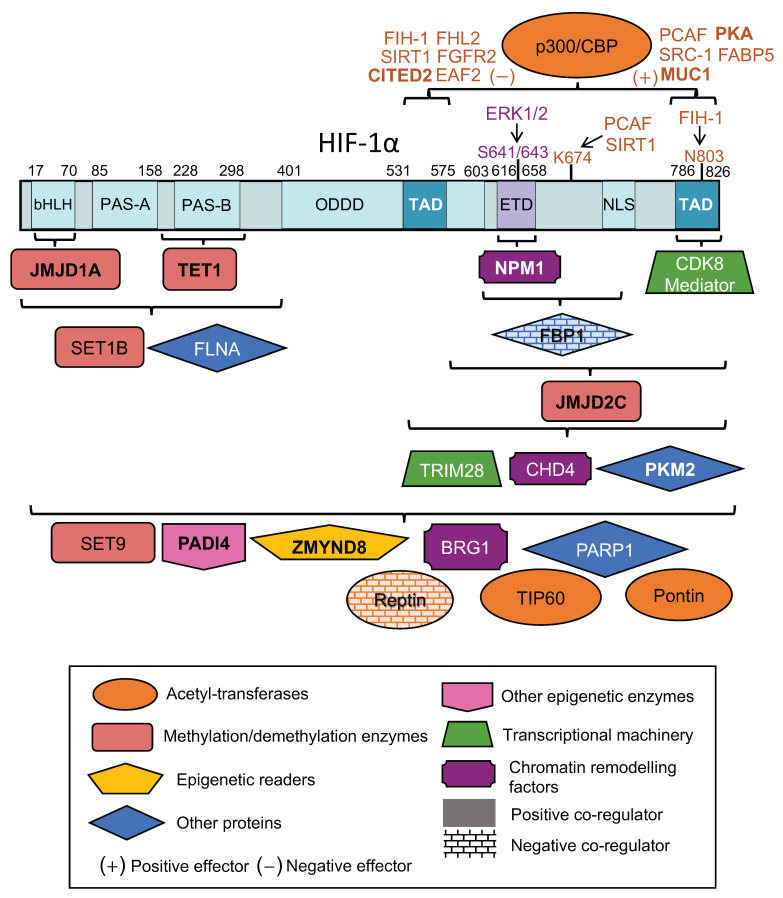
Figure 1.
Schematic representation of HIF-1α and its interacting co-regulators. Positive (+) and negative (−) effectors of the p300/CBP-HIF-1α interaction are also shown. Brackets indicate the interacting region of HIF-1α, in cases that this has been experimentally defined. Residues, modification of which is known to affect an interaction, are also indicated. Genes directly regulated by HIF-1 are shown in bold. See Table 1 and text for details and relevant references.

