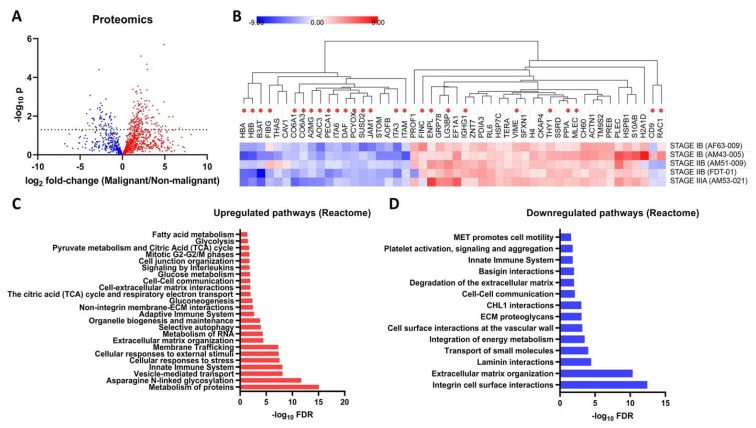
Figure 3.
Cell surface proteome of tumor and peritumoral tissues from Filipino lung cancer patients. (A) Volcano plot showing differentially expressed proteins (222 significantly different proteins) between malignant (tumor)/non-malignant (peritumoral) tissue. (B) Heatmap of selected highly-significantly different proteins between tumor and peritumoral tissue. Values are expressed as log2 fold-change tumor/peritumoral tissue. The heatmap rows are labeled according to the patient source. Proteins with reported glycosylation sites are labeled with asterisks. Selected significant Upregulated (C) and downregulated (D) Reactome pathways (FDR = 5%) are annotated using PantherDB.

