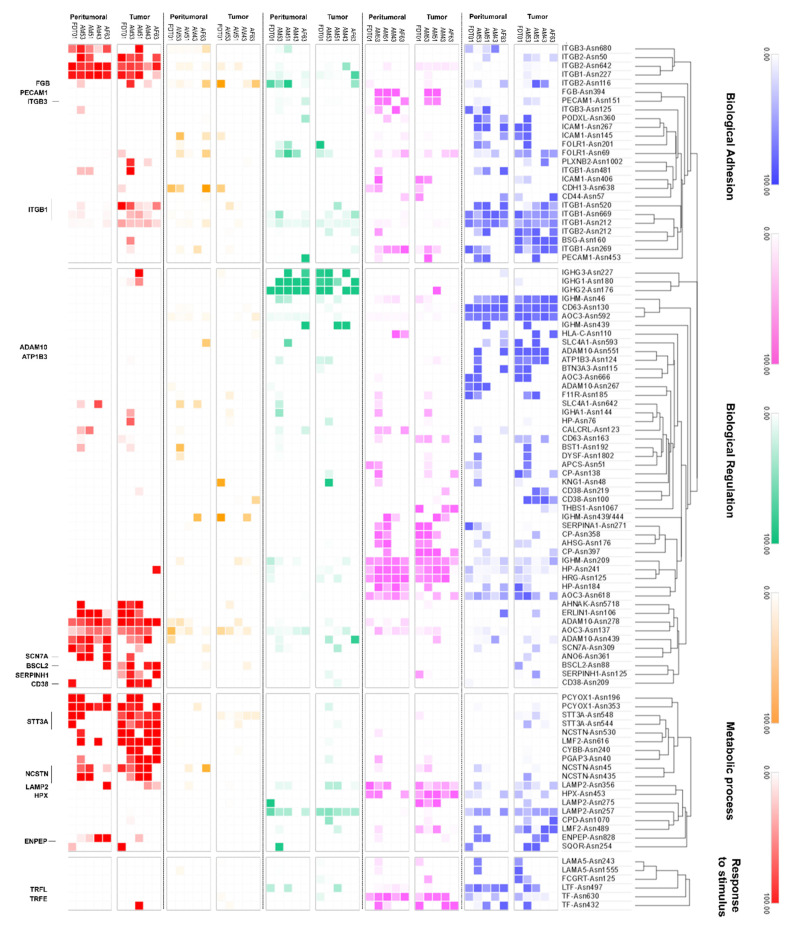
Figure 4.
Glycan distribution maps of N-glycospeptides derived from cell surface proteins from tumor and peritumoral tissues, categorized according to the type—high-mannose (red), undecorated (orange), fucosylated (green), sialylated (pink), and sialofucosylated (blue)—and annotated according to biological processes—biological adhesion, regulation, metabolic process, and response to stimulus—as characterized using site-specific glycoproteomics.

