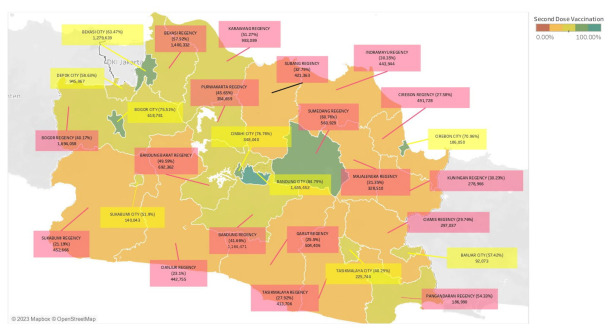
Figure 2.
Total of second dose COVID-19 vaccination number and vaccination coverage in West Java as of 23 November 2021. The map color represents vaccination coverage and the box color represents regional status; pink for regency areas and yellow for city areas. A statistical test was carried out to analyze the significant difference in vaccination numbers and vaccination coverage between the city and the regency. The result of the Saphiro–Wilk normality test has shown that the vaccination number data in the two regions are not normally distributed (p < 0.05), whereas vaccination coverage data are normally distributed (p > 0.05). The statistical test used in Table 2 and Table 3 is adjusted to the result of the normality test.

