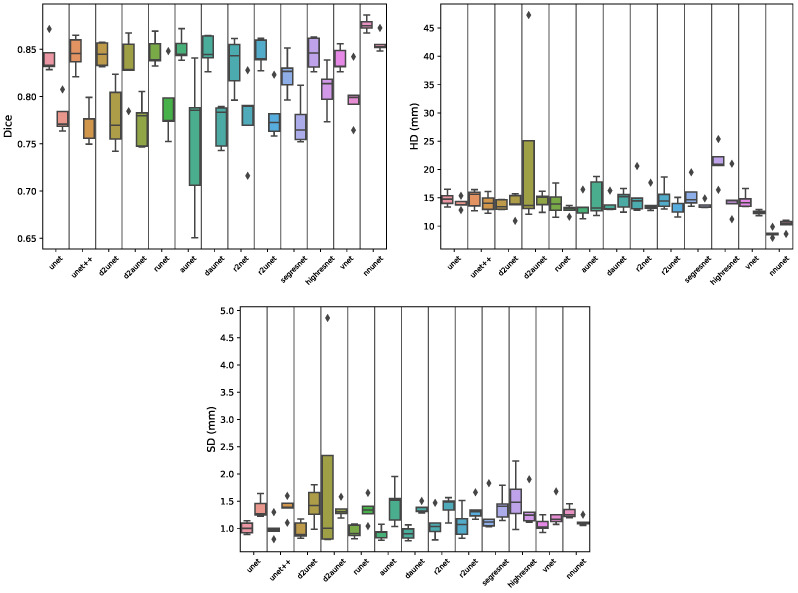
Figure 6.
Boxplots showing the distribution of Dice, Hausdorff distance (HD) and Surface distance scores per model during cross-validation for the transition segmentation task. Each segment contains a pair of boxplots, where the left one corresponds to the results of the model on the full data, and the right one on the cropped data.

