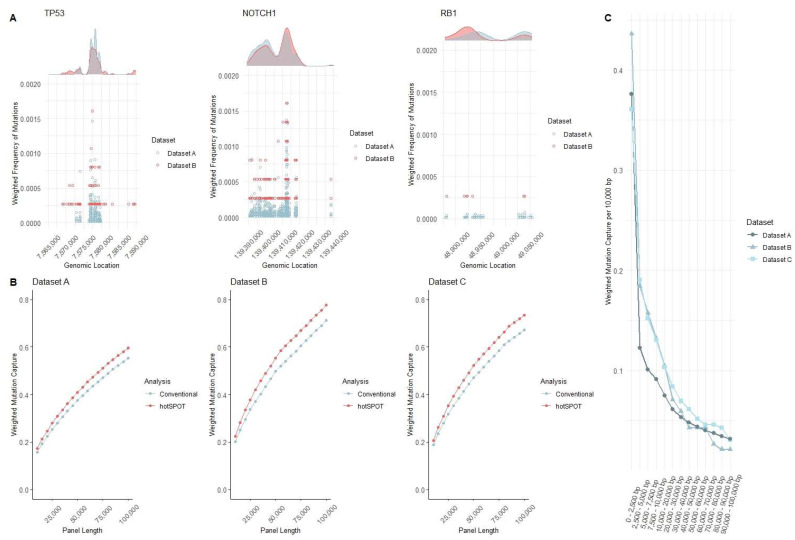
Figure 2.
Conceptualization and development of hotSPOT mutation panels. (A) Graphical representation of hotspots in frequently mutated (TP53, NOTCH1) and less frequently mutated (RB1) genes in normal skin in datasets A & B. Dots represent the frequency of mutations at each base pair. The plots above represent the density of mutations for each gene. Densities are normalized for each gene based on the average mutation frequency of the datasets. (B) Comparison of mutation capture efficacy between conventional and forward hotspot binning methods for Datasets A–C. Mutation capture for each dataset is normalized by the number of mutations present in original analysis. (C) Weighted capture efficacy of Datasets A–C ranging from the highest and lowest mutated regions generated by hotSPOT forward binning algorithm.

