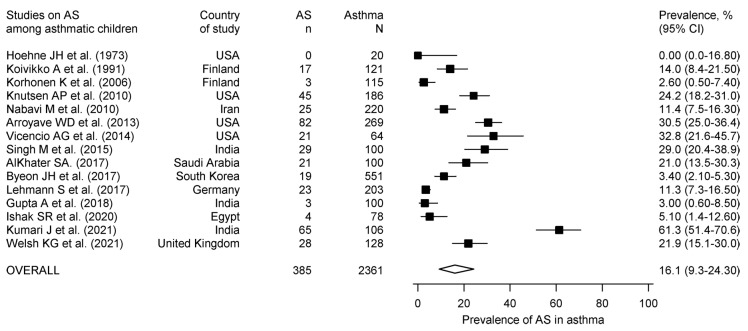
Figure 2.
Forest plot for the pooled prevalence of aspergillus sensitization in asthmatic children. The prevalence reported in the individual studies is represented by the black square with horizontal bars indicating the 95% confidence interval. The diamond at the bottom refers to the pooled prevalence with a 95% confidence interval [9,39,41,42,43,44,45,46,47,48,49,50,51,52,53].

