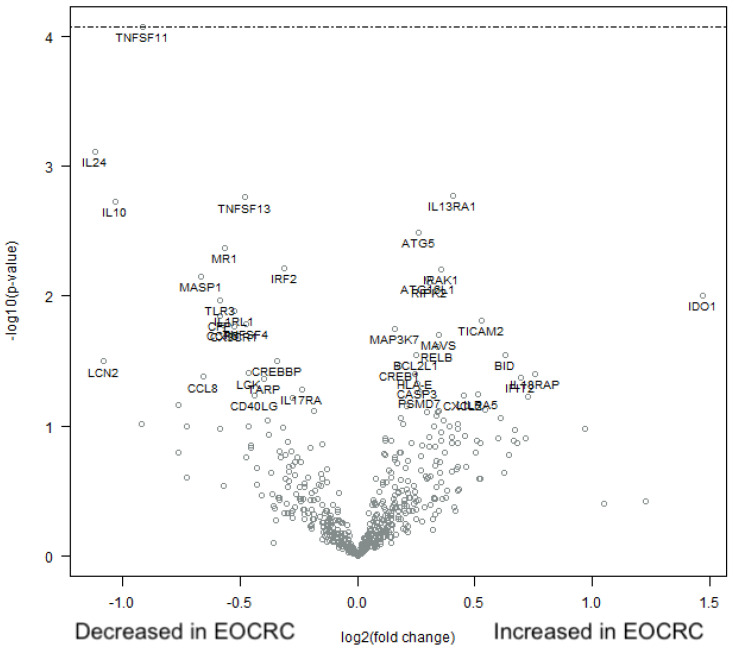
Figure 6.
Immune profile in early and average-onset CRC tumors. RNA was extracted from formalin-fixed tumor tissue sections and analyzed using nCounter PanCancer Immune Profiling Panel. A volcano plot illustrating the relative up- and down-regulation of 770 genes in EOCRC tumors with AOCRC tumors as the baseline n = 20 in each group, respectively. The dashed line for the TNSF11 gene indicates p = 0.32 (32% false discoveries) in adjustment taking biologic gene-gene interactions into account.

