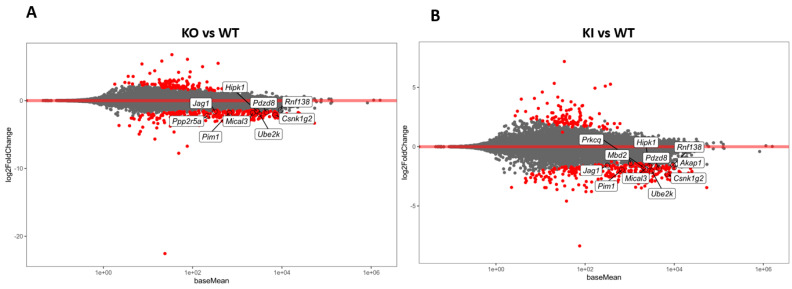
Figure 1.
Transcriptome analysis of RS from KO, KI, and WT mice. (A) MA plot (log2 fold change vs. average of counts) shows differentially expressed genes (DEGs) from KO and WT (B) MA plot (log2 fold change vs. average of counts) shows DEGs from KI and WT groups. The red dots indicate the significantly (p < 0.1) upregulated or downregulated genes in each of RS of KO or KI compared to WT.

