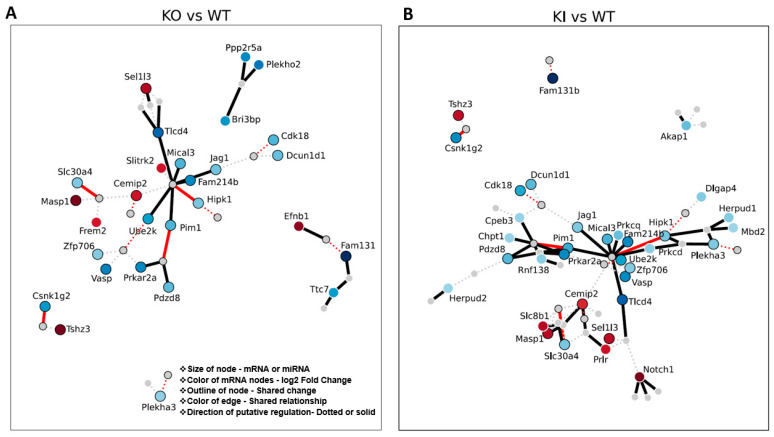
Figure 7.
Putative mRNA–miRNA target regulation (from miRNA and mRNA DEGs) in the RS of KO, KI, and WT groups. mRNA–miRNA pairs in (A) KO vs. WT or (B) KI vs. WT group showing interaction (network). mRNA–miRNA pairs (only miRNA and mRNA changed in RS) in the genotype of interest showing interaction (positive or negative) identified jointly across databases. Red circles = upregulated compared to WT. Blue circles = downregulated compared to WT. Darker color circles = higher magnitude change. Each line represents a connection of a miRNA to an mRNA if it was identified jointly across databases. Thicker line = canonical change “miRNA down and mRNA up or miRNA up and mRNA down”. Dotted line = non-canonical “miRNA down and mRNA down or miRNA up and mRNA down”. Bright red line (dotted or not) = KO and KI behave similarly. Black outline around a node (circle) = node was shared in both KO and KI DEGs. A white outline around a node means that the node was unique to that genotype.

