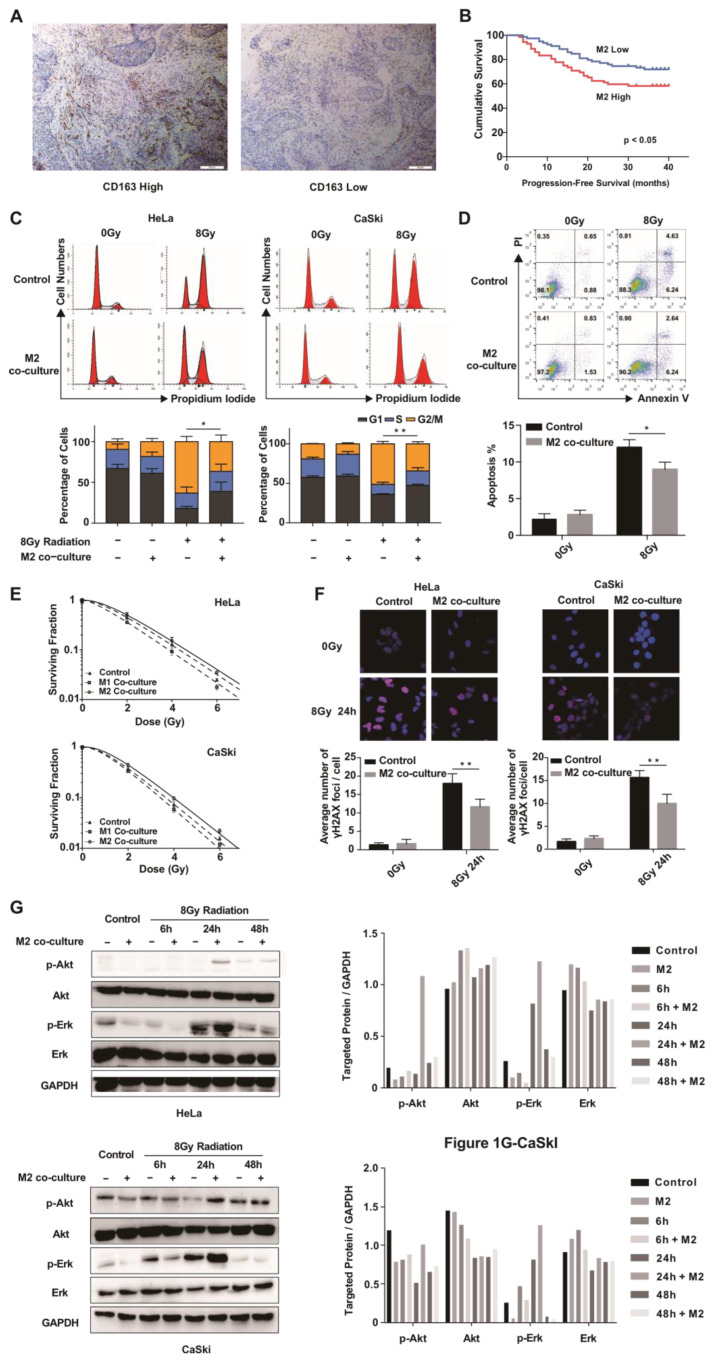
Figure 1.
M2 macrophages correlate with radiosensitivity in cervical cancer. (A) Representative staining of CD163+ high expression (left) and CD163+ low expression (right) in patients with cervical cancer. (B) PFS in the M2 macrophage-rich group and the M2 macrophage-poor group according to Kaplan–Meier analysis (cutoff = 8.94/HPF). Data were analyzed using a log-rank test. (C) Cervical cancer cell lines were co-cultured or not (control) with M2 macrophages for 24 h, followed by 8 Gy radiation. Cell cycle analysis was performed 24 h after radiation, and DNA contents were measured by propidium iodide staining followed by flow cytometry. Data are shown as mean ± SD from three independent experiments. * p < 0.05, ** p < 0.01 (Student’s t-test). (D) Cervical cancer cells (SiHa) were co-cultured with M2 macrophages or not (control) for 24 h before 8 Gy radiation. Apoptosis was analyzed by flow cytometry 48 h after radiation. Data represent both propidium iodide and Annexin V staining. Cell populations were gated to determine the apoptotic cell population (Annexin V-positive). Data are shown as mean ± SD from three independent experiments. * p < 0.05 (Student’s t-test). (E) Surviving fractions of cervical cancer cells co-cultured with M1 macrophages or M2 macrophages, or not co-cultured (control) after IR with the indicated doses. (F) Representative immunofluorescence images of γ-H2AX foci in cervical cancer cells co-cultured with M2 macrophages or not (control) 24 h after 8 Gy radiation (red, γ-H2AX; blue, DAPI). Data are shown as mean ± SD from three independent experiments. * p < 0.05, ** p < 0.01 (unpaired Student’s t test). (G) Western blot showing elevated p-Akt and p-Erk1/2 levels in M2 co-culture groups but no obvious changes in non-co-cultured groups. The whole western blots are shown in File S1.

